 1585
1585Trade Indicators
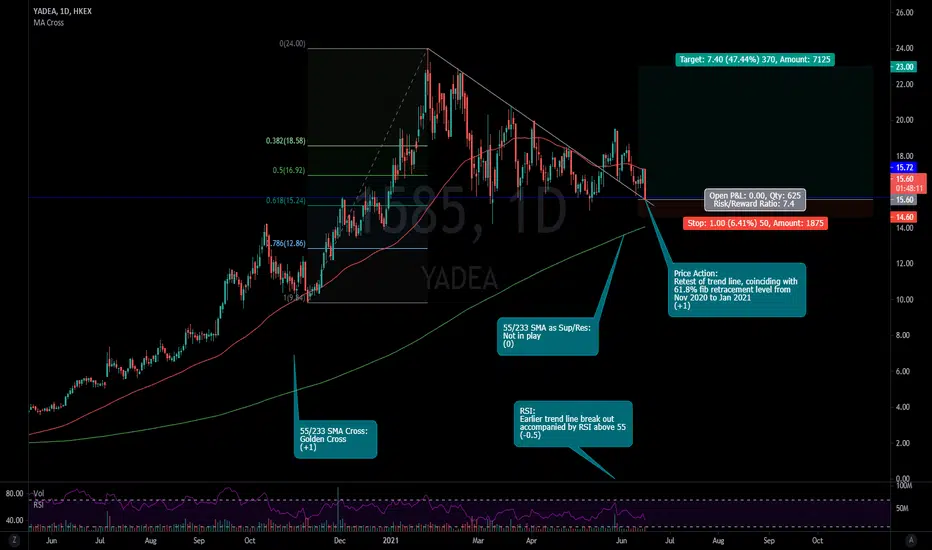
55 & 233 Daily SMA Cross: +1
Using 55 and 233 as Fibonacci versions of 50 and 200 day moving averages
Currently in golden cross.
55 & 233 Daily SMA as Support & Resistance: 0
Currently not in play.
Relative Strength Index: -0.5
Earlier trend line break on May 20 was accompanied by RSI at 58. This shows strength above 55, but not overbought below 70.
Currently weak below 45.
Price Action: +1
Price is retesting the trend line that it broke out of on May 20, and is also sitting on a key support level at around $15.72, which coincides with the 61.8% Fibonacci retracement level of the move from Nov 11 to Jan 26.
Price Levels
Entry: $15-$16
Entry between this area of strong support.
Stop Loss: $14.60
A break below $15 could suggest further downside.
Target: $23.00
Targeting to take partial profits near the all-time highs, and letting the rest run as a continuation of this uptrend that started in March 2020 is expected to continue.
https://finance.yahoo.com/news/yadea-shines-cutting-edge-electric-115000725.html

إخلاء المسؤولية
لا يُقصد بالمعلومات والمنشورات أن تكون، أو تشكل، أي نصيحة مالية أو استثمارية أو تجارية أو أنواع أخرى من النصائح أو التوصيات المقدمة أو المعتمدة من TradingView. اقرأ المزيد في شروط الاستخدام.
إخلاء المسؤولية
لا يُقصد بالمعلومات والمنشورات أن تكون، أو تشكل، أي نصيحة مالية أو استثمارية أو تجارية أو أنواع أخرى من النصائح أو التوصيات المقدمة أو المعتمدة من TradingView. اقرأ المزيد في شروط الاستخدام.