
🐳 BIGBELUGA TRADING ROADMAP
Course 01 — Classical Technical Analysis · Lesson 3
Support & Resistance: The Levels Pros Actually Trade From
Difficulty: 🐳🐋🐋🐋🐋 (Beginner)
Support and Resistance are the most talked-about concept in trading — and the most misused. Most traders draw lines randomly and call them "key levels." Professionals draw fewer lines, but each one has a reason. This lesson shows you how to identify the levels that actually matter, rank their strength, and trade them with precision.

🔵 WHY SUPPORT & RESISTANCE IS THE BACKBONE OF EVERY STRATEGY
SMC, ICT, Elliott, Gann — every advanced school ultimately reduces to one core question: where will price react? That answer comes from Support and Resistance.
A level is not a magic wall. It is a memory zone — a place where buyers or sellers previously stepped in with enough force to flip the market. The market remembers, and that's why price keeps respecting these zones again and again.
🔵 1. STATIC HORIZONTAL LEVELS
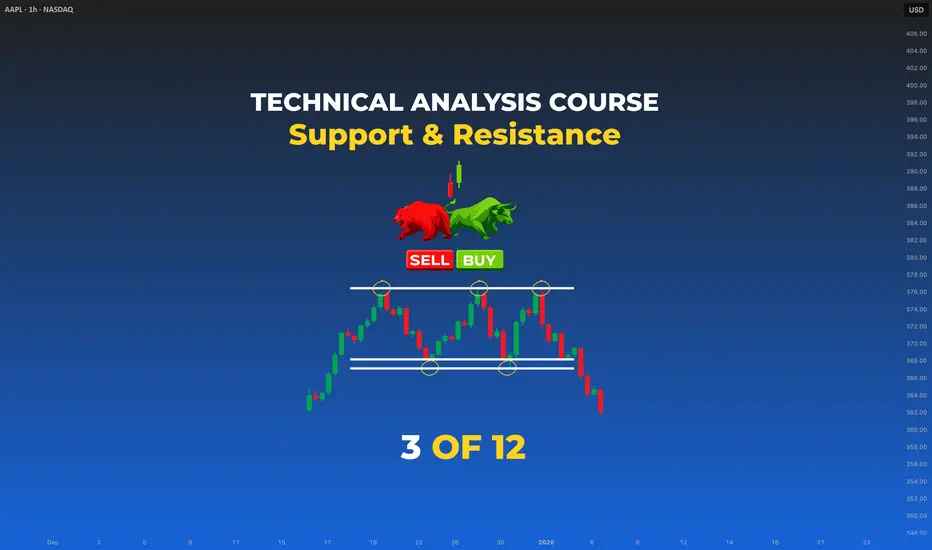
The foundation. A horizontal level is drawn across price points where the market clearly reversed in the past.

Support = a price floor where buyers consistently step in.
Resistance = a price ceiling where sellers consistently step in.
How to identify a valid level:
🐳 Pro Tip: Support and Resistance is not a line — it is a zone. Use a rectangle, not a thin line. Markets react in areas, not at exact prices.
🔵 2. DYNAMIC LEVELS
Static levels are horizontal. Dynamic levels move with price.

Two main types of dynamic levels:
In an uptrend, dynamic levels = support. In a downtrend, dynamic levels = resistance.
🐳 Pro Tip: In strong trends, the 50 EMA is the institutional dynamic support. Watch how often pullbacks bottom there.
🔵 3. THE FLIP ZONE
The most powerful concept in S/R.

When a resistance gets broken with conviction, it often becomes support on the retest.
When a support gets broken with conviction, it often becomes resistance on the retest.
This is called the Flip Zone (or Polarity Switch).
Why it works: traders who shorted at the old resistance are now underwater. When price returns to that level, they exit at break-even — creating a wall of supply that holds. The reverse logic applies to broken support.
🐳 Pro Tip: The cleanest entries in your career will come from flip zone retests. Wait for the break + retest combo. Skip the chase.
🔵 4. RANKING LEVEL STRENGTH
Not all levels are equal. A level's strength is determined by four factors:

Strong level: 5+ touches over months on the Daily, with volume spikes at each rejection.
Weak level: 2 touches in the last few hours on a 15M chart, low volume.
🐳 Pro Tip: Before drawing any level, ask: would I see this same level on the higher timeframe? If yes — keep it. If no — delete it.
🔵 5. MULTI-TIMEFRAME S/R
The same price can be a level on multiple timeframes simultaneously. When it is, it becomes a high-probability zone.

The hierarchy:
Always identify Daily and Weekly levels first. Use lower timeframes only to refine entry.
🔵 6. HOW TO TRADE S/R LIKE A PRO
Buying at Support
Wait for price to reach a strong support zone and show a reversal candle (engulfing, pin bar). Enter on confirmation, stop beyond the zone, target the next opposite level.

Selling at Resistance
Same logic, mirrored. Wait for price to reach a strong resistance and show a reversal candle. Enter on confirmation, stop beyond the zone, target the next support.

Three valid entry approaches:
Universal rules:
🔵 7. COMMON BEGINNER MISTAKES
🔵 8. YOUR S/R FRAMEWORK
Before any trade, ask these four questions in order:
These four questions filter out 90% of bad S/R trades.
🔵 QUICK SELF-CHECK
🔵 WHAT IS NEXT
Lesson 4 — Price Channels: when support and resistance run parallel to each other on an angle, you get a channel — one of the cleanest setups in classical TA. We will cover ascending, descending, and horizontal channels, how to identify the trade-able phase, and how to spot the breakout.
Drop a comment: what's the strongest level you've watched price react to recently? Share the asset.
Best Regards, BigBeluga 🐳
Course 01 — Classical Technical Analysis · Lesson 3
Support & Resistance: The Levels Pros Actually Trade From
Difficulty: 🐳🐋🐋🐋🐋 (Beginner)
Support and Resistance are the most talked-about concept in trading — and the most misused. Most traders draw lines randomly and call them "key levels." Professionals draw fewer lines, but each one has a reason. This lesson shows you how to identify the levels that actually matter, rank their strength, and trade them with precision.
🔵 WHY SUPPORT & RESISTANCE IS THE BACKBONE OF EVERY STRATEGY
SMC, ICT, Elliott, Gann — every advanced school ultimately reduces to one core question: where will price react? That answer comes from Support and Resistance.
A level is not a magic wall. It is a memory zone — a place where buyers or sellers previously stepped in with enough force to flip the market. The market remembers, and that's why price keeps respecting these zones again and again.
🔵 1. STATIC HORIZONTAL LEVELS
The foundation. A horizontal level is drawn across price points where the market clearly reversed in the past.
Support = a price floor where buyers consistently step in.
Resistance = a price ceiling where sellers consistently step in.
How to identify a valid level:
- At least 2 clear reactions (rejections) at the same price
- Visible swing highs/lows the market respected
- Clean, obvious — if you have to squint, it's not a real level
🐳 Pro Tip: Support and Resistance is not a line — it is a zone. Use a rectangle, not a thin line. Markets react in areas, not at exact prices.
🔵 2. DYNAMIC LEVELS
Static levels are horizontal. Dynamic levels move with price.
Two main types of dynamic levels:
- Moving Averages (20, 50, 100, 200 EMA) — in a strong trend, price keeps respecting one of these MAs as moving support or resistance
- Trendlines — the rising/falling diagonal lines you learned in Lesson 2 also act as dynamic S/R
In an uptrend, dynamic levels = support. In a downtrend, dynamic levels = resistance.
🐳 Pro Tip: In strong trends, the 50 EMA is the institutional dynamic support. Watch how often pullbacks bottom there.
🔵 3. THE FLIP ZONE
The most powerful concept in S/R.
When a resistance gets broken with conviction, it often becomes support on the retest.
When a support gets broken with conviction, it often becomes resistance on the retest.
This is called the Flip Zone (or Polarity Switch).
Why it works: traders who shorted at the old resistance are now underwater. When price returns to that level, they exit at break-even — creating a wall of supply that holds. The reverse logic applies to broken support.
🐳 Pro Tip: The cleanest entries in your career will come from flip zone retests. Wait for the break + retest combo. Skip the chase.
🔵 4. RANKING LEVEL STRENGTH
Not all levels are equal. A level's strength is determined by four factors:
- Number of touches — more rejections = stronger level
- Time held — the longer a level holds, the more meaningful when it breaks
- Timeframe of origin — a Daily level is stronger than a 1H level
- Volume at the level — high volume on rejection = institutional presence
Strong level: 5+ touches over months on the Daily, with volume spikes at each rejection.
Weak level: 2 touches in the last few hours on a 15M chart, low volume.
🐳 Pro Tip: Before drawing any level, ask: would I see this same level on the higher timeframe? If yes — keep it. If no — delete it.
🔵 5. MULTI-TIMEFRAME S/R
The same price can be a level on multiple timeframes simultaneously. When it is, it becomes a high-probability zone.
The hierarchy:
- Weekly / Monthly levels — the strongest. Institutions place orders here.
- Daily levels — the working bias for swing traders.
- 4H / 1H levels — useful for entries and intraday structure.
- 15M / 5M levels — execution-only. Do not anchor a trade idea here.
Always identify Daily and Weekly levels first. Use lower timeframes only to refine entry.
🔵 6. HOW TO TRADE S/R LIKE A PRO
Buying at Support
Wait for price to reach a strong support zone and show a reversal candle (engulfing, pin bar). Enter on confirmation, stop beyond the zone, target the next opposite level.
Selling at Resistance
Same logic, mirrored. Wait for price to reach a strong resistance and show a reversal candle. Enter on confirmation, stop beyond the zone, target the next support.
Three valid entry approaches:
- Bounce trade — enter at the zone after a reversal candle confirms (the examples above)
- Break-and-retest — wait for a clean break + return to the flipped level
- Range trade — between two horizontal levels, sell the top, buy the bottom
Universal rules:
- Never enter at a level — wait for reaction
- Stop loss goes beyond the zone, never inside it
- Targets = the next opposite level
🔵 7. COMMON BEGINNER MISTAKES
- Drawing too many levels — clutter kills clarity
- Treating S/R as exact prices instead of zones
- Trading the first touch of a level without confirmation
- Ignoring the higher-timeframe level when entering on lower timeframes
- Confusing a wick rejection with a body close
- Trading INTO a strong opposing level (against the wall)
- Holding a position through a clean break — hoping it was a fakeout
🔵 8. YOUR S/R FRAMEWORK
Before any trade, ask these four questions in order:
- Where are the nearest Daily and Weekly levels?
- Is price approaching a level or already at one?
- Has the level been confirmed by a clean reaction, or am I guessing?
- Where would my stop go — and does the target justify the risk?
These four questions filter out 90% of bad S/R trades.
🔵 QUICK SELF-CHECK
- Draw the major Daily levels on any chart in under 60 seconds
- Identify a flip zone and explain why it works
- Rank two levels by strength using the 4 factors
- Read S/R across at least 3 timeframes
- Choose between bounce, break-and-retest, and range trade based on context
🔵 WHAT IS NEXT
Lesson 4 — Price Channels: when support and resistance run parallel to each other on an angle, you get a channel — one of the cleanest setups in classical TA. We will cover ascending, descending, and horizontal channels, how to identify the trade-able phase, and how to spot the breakout.
Drop a comment: what's the strongest level you've watched price react to recently? Share the asset.
Best Regards, BigBeluga 🐳

🔵Gain access to our powerful tools : bigbeluga.com/tv
🔵Join our free discord for updates : discord.com/invite/FuW63RKgdc
All scripts & content provided by BigBeluga are for informational & educational purposes only.
🔵Join our free discord for updates : discord.com/invite/FuW63RKgdc
All scripts & content provided by BigBeluga are for informational & educational purposes only.
إخلاء المسؤولية
لا يُقصد بالمعلومات والمنشورات أن تكون، أو تشكل، أي نصيحة مالية أو استثمارية أو تجارية أو أنواع أخرى من النصائح أو التوصيات المقدمة أو المعتمدة من TradingView. اقرأ المزيد في شروط الاستخدام.
🔵Gain access to our powerful tools : bigbeluga.com/tv
🔵Join our free discord for updates : discord.com/invite/FuW63RKgdc
All scripts & content provided by BigBeluga are for informational & educational purposes only.
🔵Join our free discord for updates : discord.com/invite/FuW63RKgdc
All scripts & content provided by BigBeluga are for informational & educational purposes only.
إخلاء المسؤولية
لا يُقصد بالمعلومات والمنشورات أن تكون، أو تشكل، أي نصيحة مالية أو استثمارية أو تجارية أو أنواع أخرى من النصائح أو التوصيات المقدمة أو المعتمدة من TradingView. اقرأ المزيد في شروط الاستخدام.