
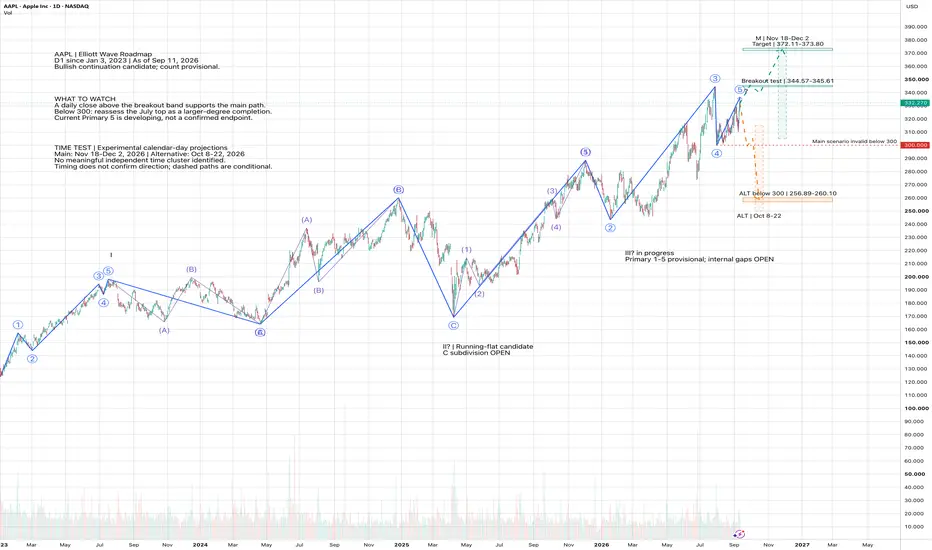
Apple is approaching an interesting moment. The recovery from the summer pullback has brought buyers back within sight of July’s high. The question now is whether they have enough strength to push through—or whether this rebound is setting up another disappointment.
The next test sits at $344.57–$345.61. Until Apple clears that band, the bullish story still has something to prove.
Looking back to January 2023, the chart tells a story of strong advances interrupted by difficult corrections. The first rally can be divided into five waves. What followed was much less straightforward: a long, overlapping stretch that produced a new high before another sharp decline into April 2025.
That messy middle matters. It leaves the larger Elliott interpretation open, even though the advance from April to December 2025 offers a clearer five-wave structure. The chart connects these smaller swings to the broader picture across three wave degrees. It does not turn every uncertain turn into a confirmed label.
The working view is that Apple may still have another upward leg ahead. But the latest recovery contains overlaps, so its final shape remains unresolved. This is a roadmap with conditions—not a claim that the next move has already been decided.
For buyers, a daily close above the breakout band would be an encouraging first step. Holding that area on a subsequent pullback would make the continuation case more convincing. If that happens, $372.11–$373.80 becomes the next projected area of interest. That zone brings together two Fibonacci measurements of earlier swings; it is a destination to watch, not a promised outcome.
The other side of the story starts at $300. Losing that summer low would undermine the immediate bullish setup and put a larger correction back in focus. The first downside reference would be around $277.58, followed by the marked $256.89–$260.10 zone. A local setback would require reassessing the count; it would not automatically erase the entire advance since 2023. Nor is $300 automatically an appropriate stop for every trade.
There is also a timing layer, although it offers less agreement than the price levels. Comparisons with earlier wave durations point to November 18–December 2, 2026 for the continuation scenario and October 8–22, 2026 for the correction alternative. These are experimental calendar-day windows. No convincing independent time cluster emerged, so neither window should be treated as a deadline or an entry signal.
For now, the most useful question is simple: can Apple turn resistance into support? The answer at the breakout band will tell us more than adding another wave label ever could.
Daily chart through September 11, 2026. Prices in USD, without dividend adjustment. Educational scenario analysis; the count remains provisional.
The next test sits at $344.57–$345.61. Until Apple clears that band, the bullish story still has something to prove.
Looking back to January 2023, the chart tells a story of strong advances interrupted by difficult corrections. The first rally can be divided into five waves. What followed was much less straightforward: a long, overlapping stretch that produced a new high before another sharp decline into April 2025.
That messy middle matters. It leaves the larger Elliott interpretation open, even though the advance from April to December 2025 offers a clearer five-wave structure. The chart connects these smaller swings to the broader picture across three wave degrees. It does not turn every uncertain turn into a confirmed label.
The working view is that Apple may still have another upward leg ahead. But the latest recovery contains overlaps, so its final shape remains unresolved. This is a roadmap with conditions—not a claim that the next move has already been decided.
For buyers, a daily close above the breakout band would be an encouraging first step. Holding that area on a subsequent pullback would make the continuation case more convincing. If that happens, $372.11–$373.80 becomes the next projected area of interest. That zone brings together two Fibonacci measurements of earlier swings; it is a destination to watch, not a promised outcome.
The other side of the story starts at $300. Losing that summer low would undermine the immediate bullish setup and put a larger correction back in focus. The first downside reference would be around $277.58, followed by the marked $256.89–$260.10 zone. A local setback would require reassessing the count; it would not automatically erase the entire advance since 2023. Nor is $300 automatically an appropriate stop for every trade.
There is also a timing layer, although it offers less agreement than the price levels. Comparisons with earlier wave durations point to November 18–December 2, 2026 for the continuation scenario and October 8–22, 2026 for the correction alternative. These are experimental calendar-day windows. No convincing independent time cluster emerged, so neither window should be treated as a deadline or an entry signal.
For now, the most useful question is simple: can Apple turn resistance into support? The answer at the breakout band will tell us more than adding another wave label ever could.
Daily chart through September 11, 2026. Prices in USD, without dividend adjustment. Educational scenario analysis; the count remains provisional.

إخلاء المسؤولية
لا يُقصد بالمعلومات والمنشورات أن تكون، أو تشكل، أي نصيحة مالية أو استثمارية أو تجارية أو أنواع أخرى من النصائح أو التوصيات المقدمة أو المعتمدة من TradingView. اقرأ المزيد في شروط الاستخدام.
إخلاء المسؤولية
لا يُقصد بالمعلومات والمنشورات أن تكون، أو تشكل، أي نصيحة مالية أو استثمارية أو تجارية أو أنواع أخرى من النصائح أو التوصيات المقدمة أو المعتمدة من TradingView. اقرأ المزيد في شروط الاستخدام.