
📊 ABB – Technical & Educational Snapshot
Ticker: NSE: ABB
Sector: ⚙️ Industrial Automation / Engineering
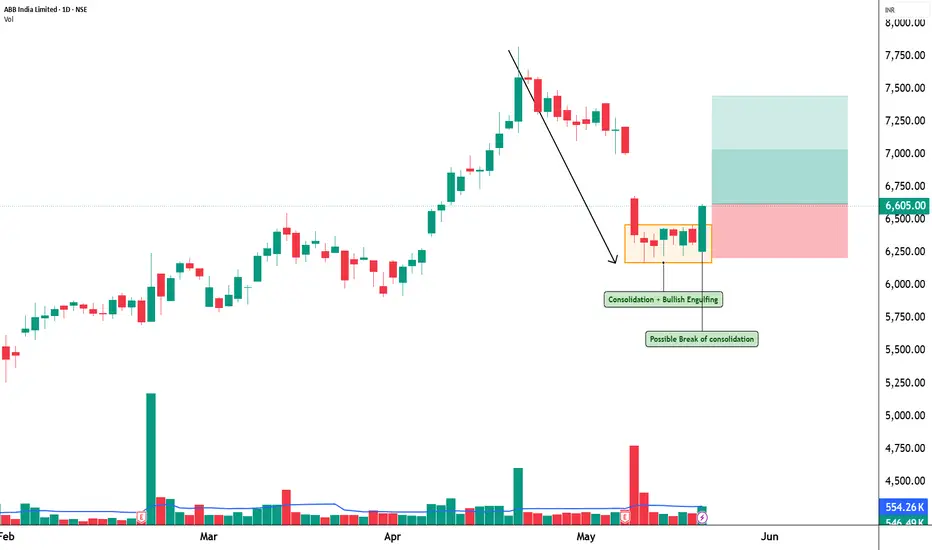
CMP: 6,605.00 ▲ (+4.36% | 20 May 2026)
Learning Rating: ⭐⭐⭐⭐☆ (Recovery Momentum Near Resistance Zone)
Chart Pattern Observed: 📊 Pullback → Stabilisation → Recovery Attempt
Candlestick Pattern Observed: Bullish Engulfing
📊 Technical Snapshot
ABB is showing a recovery attempt after witnessing corrective pressure from higher supply zones, with recent price action indicating renewed buying interest near important support levels. The latest bullish engulfing candle reflects strong short-term recovery momentum as buyers attempt to reclaim lost ground near resistance clusters. RSI is currently placed near 46.8, indicating that momentum is recovering from neutral territory rather than entering overheated conditions, leaving room for continuation if supported by follow-through buying activity. MACD remains weak but is gradually stabilising, suggesting that bearish pressure may be slowing after the recent decline. Bollinger Bands are beginning to contract after elevated volatility, reflecting possible consolidation before the next directional move. Price is now approaching an important resistance zone near prior reaction highs, and sustained acceptance above these levels may strengthen the recovery structure further.
📊 Volume Analysis
🔹 Current Volume: ~546K
🔹 Average Volume (20-period): ~554K ⚠️
📉 Volume remains near average despite the recovery candle.
💡 Interpretation: Recovery moves supported by average participation may indicate cautious buying activity rather than aggressive institutional accumulation. Stronger participation near resistance zones would improve confirmation strength.
🔑 Key Levels – Daily Timeframe
Support Areas: 6368 | 6131 | 6003
Resistance Areas: 6732 | 6860 | 7097
These are zones where price has paused or reacted earlier.
📉 Pullback Zones (Chart-Based Observation)
Healthy Pullback Zone 1: 6496 – 6441
Healthy Pullback Zone 2: 6368 – 6212
Deep Pullback Support Zone: 6003 Area
💡 Pullbacks holding above recovery zones may support continuation momentum, while deeper retracement below support can weaken the recovery structure temporarily.
What’s Catching Our Eye: Strong bullish engulfing candle after corrective pressure.
What to Watch For: Sustained acceptance above the 6732 resistance zone.
Failure Zone: Sustained weakness below 6368 weakens recovery structure.
Risks to Watch: Weak participation and rejection near overhead supply zones.
What to Expect Next: Recovery continuation with range-based movement possible.
Bullish Case: Strength above resistance may support fresh upside expansion.
Bearish Case: Failure near resistance may trigger renewed consolidation pressure.
Momentum Case: Momentum recovering but requires stronger participation confirmation.
STWP Equity Snapshot – ABB
Reference Setup:
Reference: 6,624
Invalidation Level: 6,212
Upside Reference 1: 7,035
Upside Reference 2: 7,446
STWP View:
• Sentiment: Recovery Positive | Trend: Uptrend Weakening
• RSI: 46.8 (Neutral Recovery Zone)
• Volume: Average Participation
• Structure: Bullish Recovery Attempt
Final Outlook
Momentum: Moderate
Trend: Developing Recovery
Risk: Moderate to High
Volume: Average
Learning Note: Recovery structures become stronger when bullish reversals are supported by improving participation near resistance zones.
Disclaimer:
This analysis is generated strictly for educational and analytical purposes only.
This does NOT constitute investment advice, trading advice, or a recommendation to buy or sell any security or derivative instrument.
Options trading involves substantial risk and may not be suitable for all participants.
Readers are advised to exercise independent judgment and consult a SEBI-registered financial advisor before taking any trading or investment decisions.
STWP assumes no responsibility for any financial loss arising from the use of this analysis.
💬 Recovery continuation or temporary bounce — what does the structure suggest to you?
🔼 Boost | ✍️ Comment | 🔁 Share with a learner
👉 Follow STWP for clean chart-reading insights
🚀 Stay Calm. Stay Clean. Trade With Patience.
Ticker: NSE: ABB
Sector: ⚙️ Industrial Automation / Engineering
CMP: 6,605.00 ▲ (+4.36% | 20 May 2026)
Learning Rating: ⭐⭐⭐⭐☆ (Recovery Momentum Near Resistance Zone)
Chart Pattern Observed: 📊 Pullback → Stabilisation → Recovery Attempt
Candlestick Pattern Observed: Bullish Engulfing
📊 Technical Snapshot
ABB is showing a recovery attempt after witnessing corrective pressure from higher supply zones, with recent price action indicating renewed buying interest near important support levels. The latest bullish engulfing candle reflects strong short-term recovery momentum as buyers attempt to reclaim lost ground near resistance clusters. RSI is currently placed near 46.8, indicating that momentum is recovering from neutral territory rather than entering overheated conditions, leaving room for continuation if supported by follow-through buying activity. MACD remains weak but is gradually stabilising, suggesting that bearish pressure may be slowing after the recent decline. Bollinger Bands are beginning to contract after elevated volatility, reflecting possible consolidation before the next directional move. Price is now approaching an important resistance zone near prior reaction highs, and sustained acceptance above these levels may strengthen the recovery structure further.
📊 Volume Analysis
🔹 Current Volume: ~546K
🔹 Average Volume (20-period): ~554K ⚠️
📉 Volume remains near average despite the recovery candle.
💡 Interpretation: Recovery moves supported by average participation may indicate cautious buying activity rather than aggressive institutional accumulation. Stronger participation near resistance zones would improve confirmation strength.
🔑 Key Levels – Daily Timeframe
Support Areas: 6368 | 6131 | 6003
Resistance Areas: 6732 | 6860 | 7097
These are zones where price has paused or reacted earlier.
📉 Pullback Zones (Chart-Based Observation)
Healthy Pullback Zone 1: 6496 – 6441
Healthy Pullback Zone 2: 6368 – 6212
Deep Pullback Support Zone: 6003 Area
💡 Pullbacks holding above recovery zones may support continuation momentum, while deeper retracement below support can weaken the recovery structure temporarily.
What’s Catching Our Eye: Strong bullish engulfing candle after corrective pressure.
What to Watch For: Sustained acceptance above the 6732 resistance zone.
Failure Zone: Sustained weakness below 6368 weakens recovery structure.
Risks to Watch: Weak participation and rejection near overhead supply zones.
What to Expect Next: Recovery continuation with range-based movement possible.
Bullish Case: Strength above resistance may support fresh upside expansion.
Bearish Case: Failure near resistance may trigger renewed consolidation pressure.
Momentum Case: Momentum recovering but requires stronger participation confirmation.
STWP Equity Snapshot – ABB
Reference Setup:
Reference: 6,624
Invalidation Level: 6,212
Upside Reference 1: 7,035
Upside Reference 2: 7,446
STWP View:
• Sentiment: Recovery Positive | Trend: Uptrend Weakening
• RSI: 46.8 (Neutral Recovery Zone)
• Volume: Average Participation
• Structure: Bullish Recovery Attempt
Final Outlook
Momentum: Moderate
Trend: Developing Recovery
Risk: Moderate to High
Volume: Average
Learning Note: Recovery structures become stronger when bullish reversals are supported by improving participation near resistance zones.
Disclaimer:
This analysis is generated strictly for educational and analytical purposes only.
This does NOT constitute investment advice, trading advice, or a recommendation to buy or sell any security or derivative instrument.
Options trading involves substantial risk and may not be suitable for all participants.
Readers are advised to exercise independent judgment and consult a SEBI-registered financial advisor before taking any trading or investment decisions.
STWP assumes no responsibility for any financial loss arising from the use of this analysis.
💬 Recovery continuation or temporary bounce — what does the structure suggest to you?
🔼 Boost | ✍️ Comment | 🔁 Share with a learner
👉 Follow STWP for clean chart-reading insights
🚀 Stay Calm. Stay Clean. Trade With Patience.

STWP | Mentor & Demand-Supply Specialist |
Empowering traders through structured learning |
simpletradewithpatience.com
chat.whatsapp.com/CpgyHCfioQ5Hxf7rd8pDqw
wa.me/message/6IOPHGOXMGZ4N1
Educational Only
Empowering traders through structured learning |
simpletradewithpatience.com
chat.whatsapp.com/CpgyHCfioQ5Hxf7rd8pDqw
wa.me/message/6IOPHGOXMGZ4N1
Educational Only
إخلاء المسؤولية
لا يُقصد بالمعلومات والمنشورات أن تكون، أو تشكل، أي نصيحة مالية أو استثمارية أو تجارية أو أنواع أخرى من النصائح أو التوصيات المقدمة أو المعتمدة من TradingView. اقرأ المزيد في شروط الاستخدام.
STWP | Mentor & Demand-Supply Specialist |
Empowering traders through structured learning |
simpletradewithpatience.com
chat.whatsapp.com/CpgyHCfioQ5Hxf7rd8pDqw
wa.me/message/6IOPHGOXMGZ4N1
Educational Only
Empowering traders through structured learning |
simpletradewithpatience.com
chat.whatsapp.com/CpgyHCfioQ5Hxf7rd8pDqw
wa.me/message/6IOPHGOXMGZ4N1
Educational Only
إخلاء المسؤولية
لا يُقصد بالمعلومات والمنشورات أن تكون، أو تشكل، أي نصيحة مالية أو استثمارية أو تجارية أو أنواع أخرى من النصائح أو التوصيات المقدمة أو المعتمدة من TradingView. اقرأ المزيد في شروط الاستخدام.