
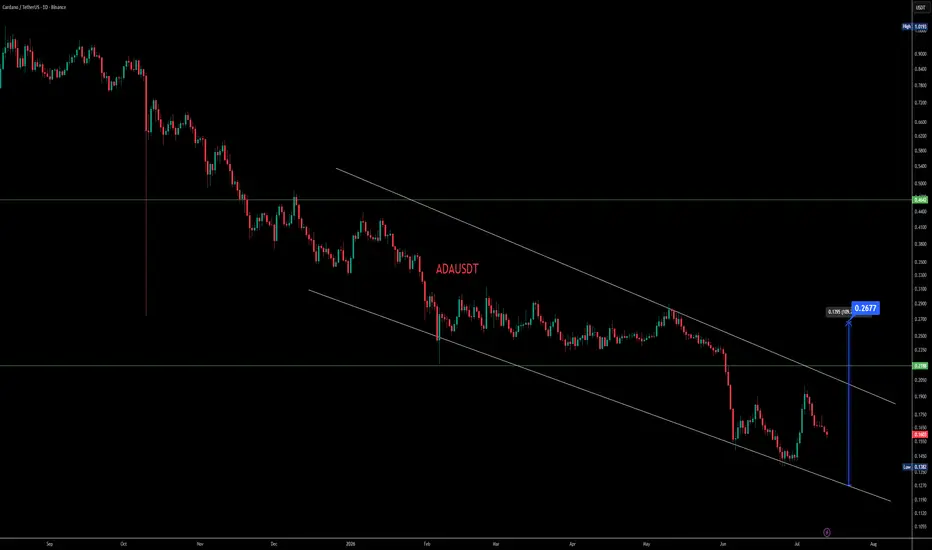
ADAUSDT is trading on the 1D timeframe within a well-defined descending channel, with price respecting both the upper and lower trendlines visible on the chart.
The current price is trading around the 0.1603 area after rebounding from the lower boundary of the channel. This keeps price inside the existing bearish structure while testing whether buyers can build enough momentum for a trend change.
Key levels to watch:
Support: around 0.1382–0.1342, near the lower channel boundary.
Resistance: the descending channel resistance near 0.19–0.20, followed by the horizontal level around 0.2188.
A confirmed breakout above the upper channel trendline could signal improving bullish momentum. If that breakout is confirmed, the chart projects a potential move toward 0.2677, representing approximately 109% from the marked low on the chart.
If price fails to break the channel resistance and loses the 0.1382–0.1342 support zone, the bullish scenario may become invalid, and the current downtrend structure could remain in effect.
This chart is shared for educational purposes. Watch for confirmation before considering any directional bias.

Twitter: x.com/crypto_vulture1
📊 TA & strategies
Telegram: t.me/crypto_vulture_signals
📊 TA & strategies
Telegram: t.me/crypto_vulture_signals
إخلاء المسؤولية
لا يُقصد بالمعلومات والمنشورات أن تكون، أو تشكل، أي نصيحة مالية أو استثمارية أو تجارية أو أنواع أخرى من النصائح أو التوصيات المقدمة أو المعتمدة من TradingView. اقرأ المزيد في شروط الاستخدام.