
Cardano (ADA) technical analysis:
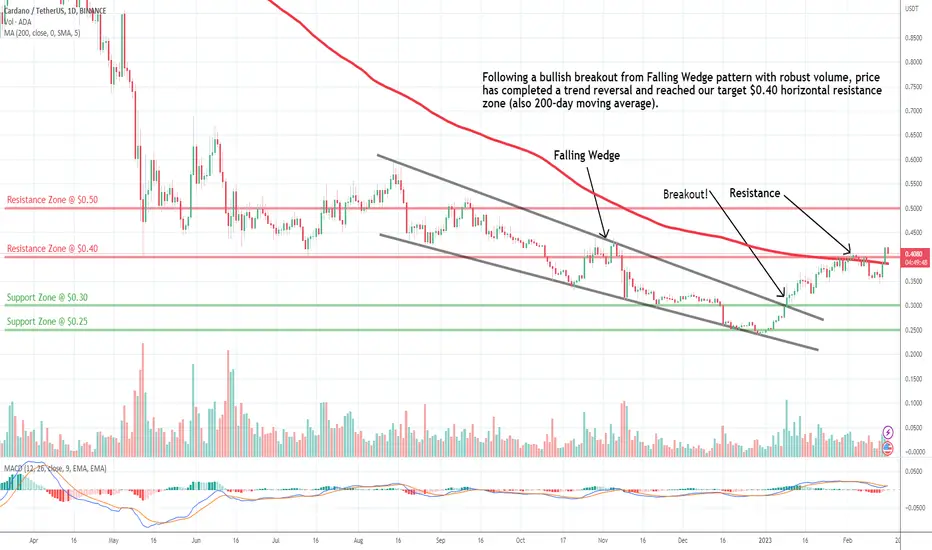
Trade setup: Following a bullish breakout from Falling Wedge pattern with robust volume, price has completed a trend reversal and reached our target $0.40 horizontal resistance zone (also 200-day moving average). Wait for price to either 1) break above $0.40 to resume uptrend, or 2) pull back near $0.30 support for a swing entry.
Trend: Uptrend on Short- and Medium-Term basis and Neutral on Long-Term basis.
Momentum is Mixed as MACD Line is below MACD Signal Line (Bearish) but RSI > 55 (Bullish). MACD Histogram bars are rising, which suggests that momentum could be nearing another upswing.
Support and Resistance: Nearest Support Zone is $0.30 (previous resistance), then $0.25. The nearest Resistance Zone is $0.40, which it broke, then $0.50.

إخلاء المسؤولية
لا يُقصد بالمعلومات والمنشورات أن تكون، أو تشكل، أي نصيحة مالية أو استثمارية أو تجارية أو أنواع أخرى من النصائح أو التوصيات المقدمة أو المعتمدة من TradingView. اقرأ المزيد في شروط الاستخدام.
إخلاء المسؤولية
لا يُقصد بالمعلومات والمنشورات أن تكون، أو تشكل، أي نصيحة مالية أو استثمارية أو تجارية أو أنواع أخرى من النصائح أو التوصيات المقدمة أو المعتمدة من TradingView. اقرأ المزيد في شروط الاستخدام.