بيع على المكشوف
A Corrective Mess
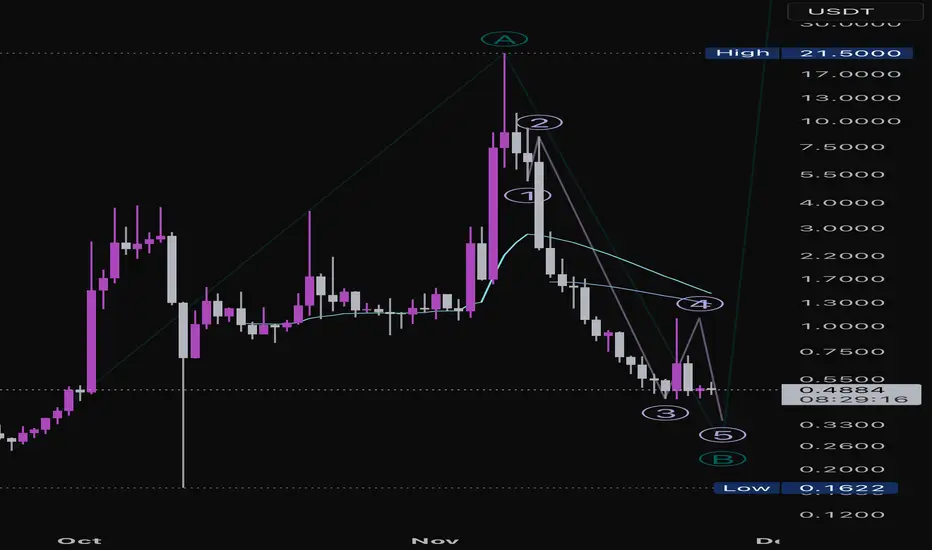
Hard to count this chart as anything but long-term bearish, but my best Elliot interpretation of AIA is that we could be in wave 4 of C of B to the downside. Very short term, we could see another [relatively] small rally to the 1.09-1.3ish area, but volume is low and further downside is expected with or without a C wave up. A break above the intraday high would be a first signal for a C wave, break below 0.439 for larger trend continuation.
ملاحظة
Clarification: very short-term possibility is Wave c of 4, not Wave C of larger ABC count. Standard Fibonacci extension targets if we do get a Wave c of 4 rally: 1.09-1.49
إخلاء المسؤولية
لا يُقصد بالمعلومات والمنشورات أن تكون، أو تشكل، أي نصيحة مالية أو استثمارية أو تجارية أو أنواع أخرى من النصائح أو التوصيات المقدمة أو المعتمدة من TradingView. اقرأ المزيد في شروط الاستخدام.
إخلاء المسؤولية
لا يُقصد بالمعلومات والمنشورات أن تكون، أو تشكل، أي نصيحة مالية أو استثمارية أو تجارية أو أنواع أخرى من النصائح أو التوصيات المقدمة أو المعتمدة من TradingView. اقرأ المزيد في شروط الاستخدام.