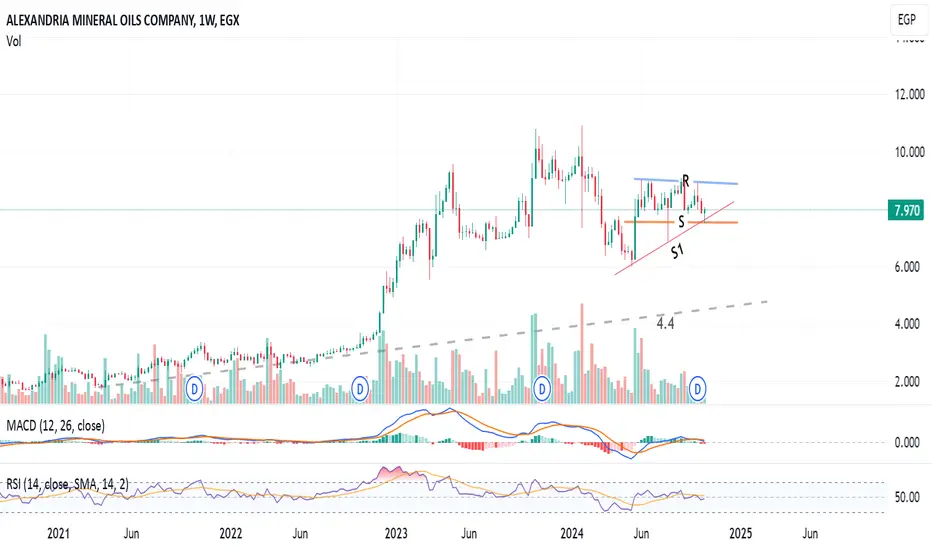
Daily chart
The stock AMOC is trading in a channel between lines R and S, so the opportunity to buy near support S and sell near resistance line R (at around 8.9)
Technical indicators RSI and MACD are supporting the bullish view.
Closing above 9.0 for 3 days, the target will be 10.5
Closing above 10.9 for 2 weeks, the target will be 12
Below line S is considered a stop loss level, as the next down target will be 6.0
Note: Always keep a profit protection level, and raise it as the price goes up.
The stock
AMOC is trading in a channel between lines R and S, so the opportunity to buy near support S and sell near resistance line R (at around 8.9)Technical indicators RSI and MACD are supporting the bullish view.
Closing above 9.0 for 3 days, the target will be 10.5
Closing above 10.9 for 2 weeks, the target will be 12
Below line S is considered a stop loss level, as the next down target will be 6.0
Note: Always keep a profit protection level, and raise it as the price goes up.

إخلاء المسؤولية
لا يُقصد بالمعلومات والمنشورات أن تكون، أو تشكل، أي نصيحة مالية أو استثمارية أو تجارية أو أنواع أخرى من النصائح أو التوصيات المقدمة أو المعتمدة من TradingView. اقرأ المزيد في شروط الاستخدام.
إخلاء المسؤولية
لا يُقصد بالمعلومات والمنشورات أن تكون، أو تشكل، أي نصيحة مالية أو استثمارية أو تجارية أو أنواع أخرى من النصائح أو التوصيات المقدمة أو المعتمدة من TradingView. اقرأ المزيد في شروط الاستخدام.