
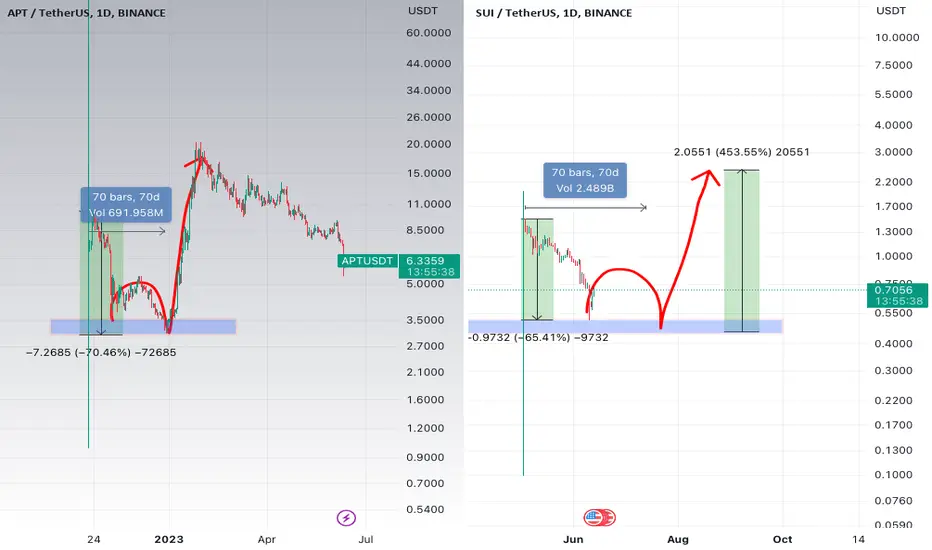
Friends, hello everyone! I noticed an interesting similarity between two assets - SUI and Atop. After the decline, both assets experienced approximately a 70% loss. However, if we look at APT, we can observe an intriguing pattern - it showed a decline, followed by a minor correction, a final impulse (where the best entry point was), and a 400% increase.
Now, as SUI has undergone a decline, we are observing a slight correction, after which we expect a final impulse and further growth.
It's fascinating to see what will happen with these assets going forward! Let's keep an eye out for updates.
Now, as SUI has undergone a decline, we are observing a slight correction, after which we expect a final impulse and further growth.
It's fascinating to see what will happen with these assets going forward! Let's keep an eye out for updates.

Copy my strategy - copy.mytimebox.app/
TG ENG - t.me/+B_BEn6COneo2ZTBi
TG - t.me/+LTNPinehDNlkZTQy
TG ENG - t.me/+B_BEn6COneo2ZTBi
TG - t.me/+LTNPinehDNlkZTQy
إخلاء المسؤولية
لا يُقصد بالمعلومات والمنشورات أن تكون، أو تشكل، أي نصيحة مالية أو استثمارية أو تجارية أو أنواع أخرى من النصائح أو التوصيات المقدمة أو المعتمدة من TradingView. اقرأ المزيد في شروط الاستخدام.
Copy my strategy - copy.mytimebox.app/
TG ENG - t.me/+B_BEn6COneo2ZTBi
TG - t.me/+LTNPinehDNlkZTQy
TG ENG - t.me/+B_BEn6COneo2ZTBi
TG - t.me/+LTNPinehDNlkZTQy
إخلاء المسؤولية
لا يُقصد بالمعلومات والمنشورات أن تكون، أو تشكل، أي نصيحة مالية أو استثمارية أو تجارية أو أنواع أخرى من النصائح أو التوصيات المقدمة أو المعتمدة من TradingView. اقرأ المزيد في شروط الاستخدام.