
Just charts
ملاحظة
ARK ETF divided in channels:ملاحظة
H4 chart:ملاحظة
H1 range breakout:ملاحظة
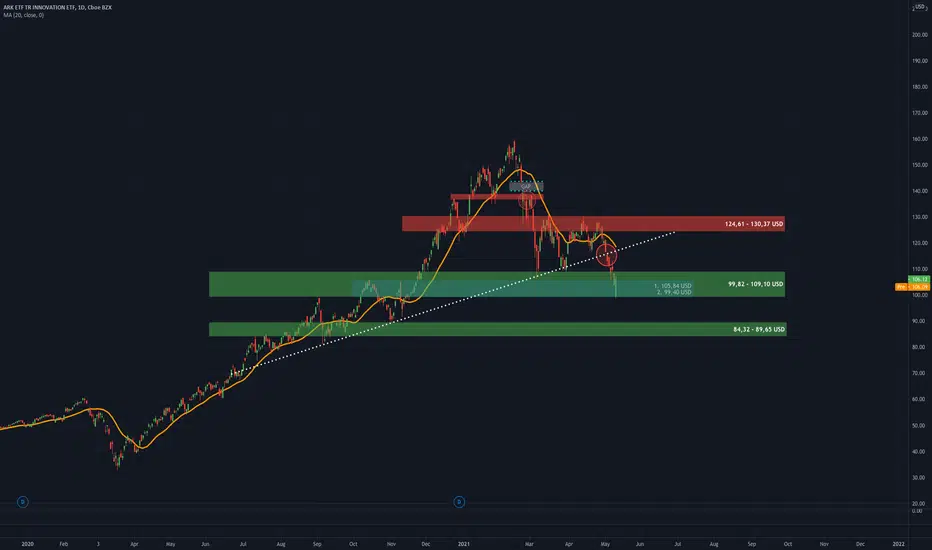
If you have a growth stock portfolio you can't avoid watching the ark etf. I analyzed the ETF for you. And do you notice something? If you have a growth stock portfolio, it reflects your portfolio very well. I use the ark etf as a benchmark index for my growth values.You can see important levels in the chart. I used different timeframes. A quick look at the chart:
D1: The daily shows a trend break. The break below the dashed & strong trendline was a first bearish signal. We are currently in the support area, but it is under great pressure.
H10: I used the h10 chart to draw important channels. The tertiary channel has signaled a danger to me. At a certain point, these become a short possibility. Why? Because the ETF was way too hyped. So remember: tertiary channels are dangerous in the near term. Pullbacks were to be expected. Because: a trend is not possible forever.
H4: In the H4 you can see the exact levels again.
H1: I included fibo in H1.

إخلاء المسؤولية
لا يُقصد بالمعلومات والمنشورات أن تكون، أو تشكل، أي نصيحة مالية أو استثمارية أو تجارية أو أنواع أخرى من النصائح أو التوصيات المقدمة أو المعتمدة من TradingView. اقرأ المزيد في شروط الاستخدام.
إخلاء المسؤولية
لا يُقصد بالمعلومات والمنشورات أن تكون، أو تشكل، أي نصيحة مالية أو استثمارية أو تجارية أو أنواع أخرى من النصائح أو التوصيات المقدمة أو المعتمدة من TradingView. اقرأ المزيد في شروط الاستخدام.