
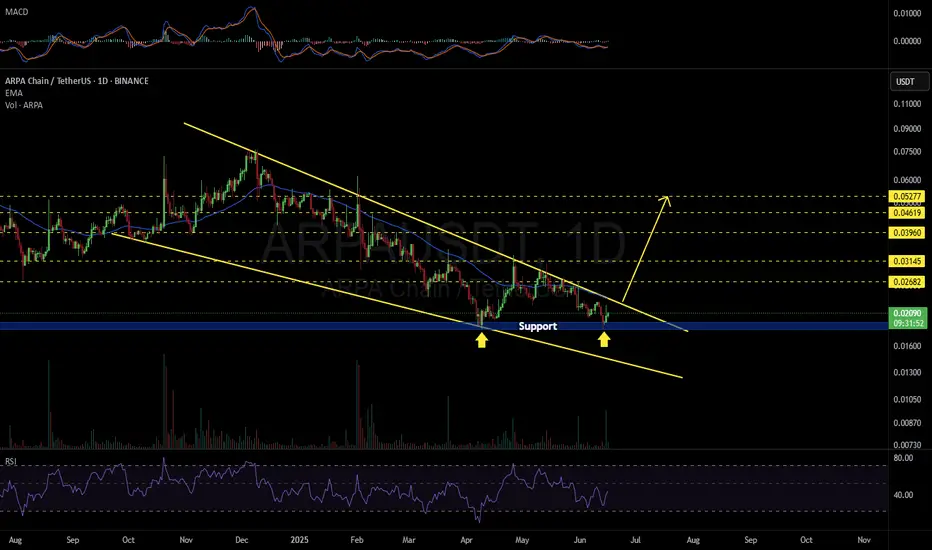
#ARPA is moving inside a Falling Wedge pattern on the daily chart — a classic bullish reversal signal.
If the price breaks above the wedge resistance and the daily EMA50, the following targets come into play:
🎯 $0.02682
🎯 $0.03145
🎯 $0.03960
🎯 $0.04619
🎯 $0.05277
⚠️ Always use a tight stop-loss to manage risk and protect your capital.
If the price breaks above the wedge resistance and the daily EMA50, the following targets come into play:
🎯 $0.02682
🎯 $0.03145
🎯 $0.03960
🎯 $0.04619
🎯 $0.05277
⚠️ Always use a tight stop-loss to manage risk and protect your capital.

إخلاء المسؤولية
لا يُقصد بالمعلومات والمنشورات أن تكون، أو تشكل، أي نصيحة مالية أو استثمارية أو تجارية أو أنواع أخرى من النصائح أو التوصيات المقدمة أو المعتمدة من TradingView. اقرأ المزيد في شروط الاستخدام.
إخلاء المسؤولية
لا يُقصد بالمعلومات والمنشورات أن تكون، أو تشكل، أي نصيحة مالية أو استثمارية أو تجارية أو أنواع أخرى من النصائح أو التوصيات المقدمة أو المعتمدة من TradingView. اقرأ المزيد في شروط الاستخدام.