شراء
ATA/USDT — Descending Channel Breakdown or Reversal Opportunity?
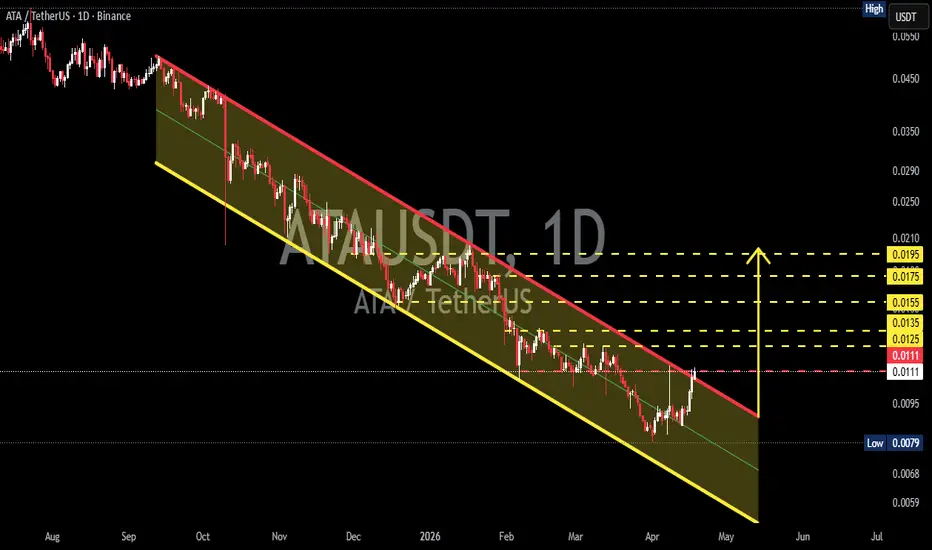
On the 1D timeframe, ATA/USDT is clearly moving within a Descending Channel (Bearish Channel) over the past few months. Price continues to form lower highs and lower lows, indicating strong and consistent selling pressure.
This channel is defined by:
Resistance (red line) → dynamic supply zone
Support (yellow line) → temporary demand zone
Currently, price is attempting a rebound from the lower channel support and approaching the upper resistance.
---
📐 Pattern Explanation: Descending Channel
This pattern is typically a bearish continuation pattern, but it can also signal a reversal if a breakout occurs to the upside.
Key characteristics:
Downtrend with a well-structured movement
Repeated price reactions between two parallel trendlines
Volume tends to decrease as price approaches the end of the channel
📌 At this stage, price is in a critical phase: retesting the channel resistance
---
🚀 Bullish Scenario
A bullish move will be confirmed if price manages to break out and close above the channel resistance (red line).
Additional confirmations:
Strong breakout candle (large body)
Successful retest turning resistance into support
Increasing volume
🎯 Upside targets (based on horizontal levels):
0.0125
0.0135
0.0155
0.0175
0.0195
📈 A valid breakout could signal an early trend reversal after a prolonged downtrend.
---
🐻 Bearish Scenario
Bearish continuation remains likely if price:
Fails to break the channel resistance
Gets strongly rejected from the upper boundary
Confirmations:
Long upper wicks at resistance
Bearish engulfing or rejection candles
Increasing selling volume
🎯 Downside targets:
Return to channel support
Breakdown below support → potential drop below 0.0079 (previous low)
📉 This would confirm the pattern as a continuation of the bearish trend
---
⚠️ Key Levels to Watch
Channel Resistance (red) → critical breakout zone
Channel Support (yellow) → main support area
0.0111 zone → current reaction level (mid-level)
Upper targets (0.0125 – 0.0195) → layered resistance zones
---
🧠 Conclusion
ATA/USDT is currently at a decision point. A breakout above the channel could trigger a reversal, while rejection would likely continue the bearish trend.
Traders should wait for clear confirmation of either breakout or rejection, as the current zone is highly sensitive.
#ATAUSDT #CryptoAnalysis #TechnicalAnalysis #DescendingChannel #BreakoutSetup #Altcoins #BearishTrend #BullishReversal #PriceAction #CryptoTrading #SupportResistance
This channel is defined by:
Resistance (red line) → dynamic supply zone
Support (yellow line) → temporary demand zone
Currently, price is attempting a rebound from the lower channel support and approaching the upper resistance.
---
📐 Pattern Explanation: Descending Channel
This pattern is typically a bearish continuation pattern, but it can also signal a reversal if a breakout occurs to the upside.
Key characteristics:
Downtrend with a well-structured movement
Repeated price reactions between two parallel trendlines
Volume tends to decrease as price approaches the end of the channel
📌 At this stage, price is in a critical phase: retesting the channel resistance
---
🚀 Bullish Scenario
A bullish move will be confirmed if price manages to break out and close above the channel resistance (red line).
Additional confirmations:
Strong breakout candle (large body)
Successful retest turning resistance into support
Increasing volume
🎯 Upside targets (based on horizontal levels):
0.0125
0.0135
0.0155
0.0175
0.0195
📈 A valid breakout could signal an early trend reversal after a prolonged downtrend.
---
🐻 Bearish Scenario
Bearish continuation remains likely if price:
Fails to break the channel resistance
Gets strongly rejected from the upper boundary
Confirmations:
Long upper wicks at resistance
Bearish engulfing or rejection candles
Increasing selling volume
🎯 Downside targets:
Return to channel support
Breakdown below support → potential drop below 0.0079 (previous low)
📉 This would confirm the pattern as a continuation of the bearish trend
---
⚠️ Key Levels to Watch
Channel Resistance (red) → critical breakout zone
Channel Support (yellow) → main support area
0.0111 zone → current reaction level (mid-level)
Upper targets (0.0125 – 0.0195) → layered resistance zones
---
🧠 Conclusion
ATA/USDT is currently at a decision point. A breakout above the channel could trigger a reversal, while rejection would likely continue the bearish trend.
Traders should wait for clear confirmation of either breakout or rejection, as the current zone is highly sensitive.
#ATAUSDT #CryptoAnalysis #TechnicalAnalysis #DescendingChannel #BreakoutSetup #Altcoins #BearishTrend #BullishReversal #PriceAction #CryptoTrading #SupportResistance

✅ Get Free Signals! Join Our Telegram Channel Here: t.me/TheCryptoNuclear
✅ Twitter: twitter.com/crypto_nuclear
✅ Join Bybit : partner.bybit.com/b/nuclearvip
✅ Benefits : Lifetime Trading Fee Discount -50%
✅ Twitter: twitter.com/crypto_nuclear
✅ Join Bybit : partner.bybit.com/b/nuclearvip
✅ Benefits : Lifetime Trading Fee Discount -50%
إخلاء المسؤولية
لا يُقصد بالمعلومات والمنشورات أن تكون، أو تشكل، أي نصيحة مالية أو استثمارية أو تجارية أو أنواع أخرى من النصائح أو التوصيات المقدمة أو المعتمدة من TradingView. اقرأ المزيد في شروط الاستخدام.
✅ Get Free Signals! Join Our Telegram Channel Here: t.me/TheCryptoNuclear
✅ Twitter: twitter.com/crypto_nuclear
✅ Join Bybit : partner.bybit.com/b/nuclearvip
✅ Benefits : Lifetime Trading Fee Discount -50%
✅ Twitter: twitter.com/crypto_nuclear
✅ Join Bybit : partner.bybit.com/b/nuclearvip
✅ Benefits : Lifetime Trading Fee Discount -50%
إخلاء المسؤولية
لا يُقصد بالمعلومات والمنشورات أن تكون، أو تشكل، أي نصيحة مالية أو استثمارية أو تجارية أو أنواع أخرى من النصائح أو التوصيات المقدمة أو المعتمدة من TradingView. اقرأ المزيد في شروط الاستخدام.