
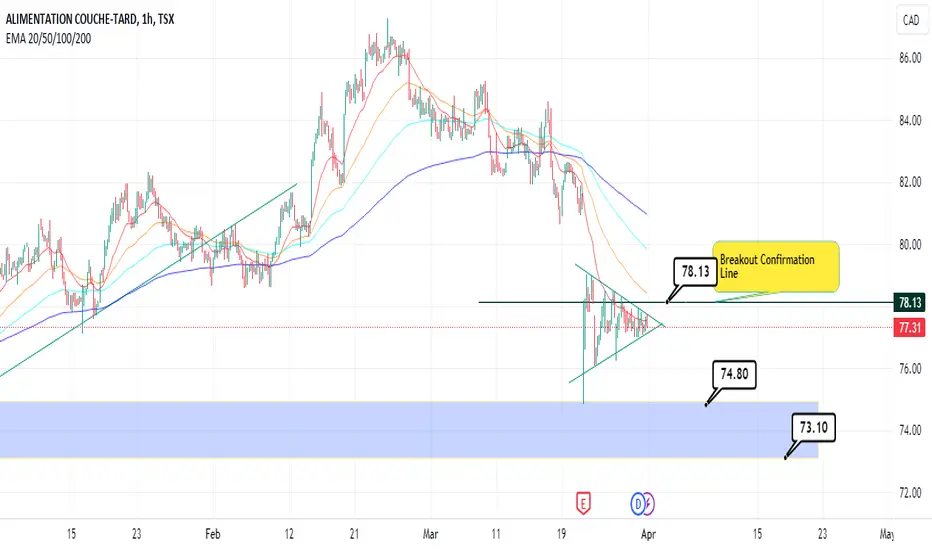
There’s a clear symmetric triangle nearing a breakout and it can go any side as this pattern typically indicates a period of consolidation, with the price breakout direction being uncertain.
In case of a bearish breakout, there’s a strong support zone between $74 and $73. I’d suggest you to wait until the price breaks out above the red EMA 20 line on this hourly chart.
In case of a bearish breakout, there’s a strong support zone between $74 and $73. I’d suggest you to wait until the price breaks out above the red EMA 20 line on this hourly chart.

إخلاء المسؤولية
لا يُقصد بالمعلومات والمنشورات أن تكون، أو تشكل، أي نصيحة مالية أو استثمارية أو تجارية أو أنواع أخرى من النصائح أو التوصيات المقدمة أو المعتمدة من TradingView. اقرأ المزيد في شروط الاستخدام.
إخلاء المسؤولية
لا يُقصد بالمعلومات والمنشورات أن تكون، أو تشكل، أي نصيحة مالية أو استثمارية أو تجارية أو أنواع أخرى من النصائح أو التوصيات المقدمة أو المعتمدة من TradingView. اقرأ المزيد في شروط الاستخدام.