

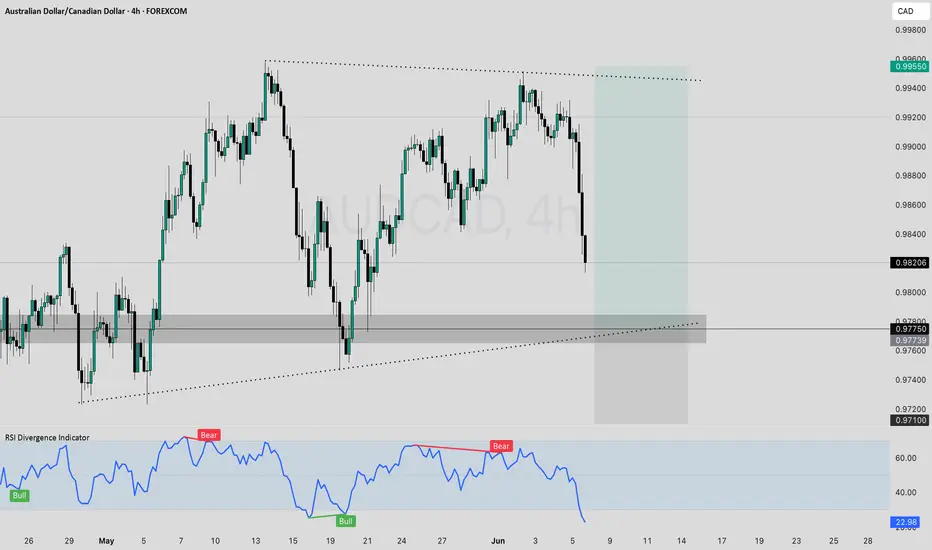
AUDCAD continues to show strength across the higher timeframes as the fundamental and technical picture remains firmly tilted in favor of the Australian Dollar.
The divergence between the RBA and the BoC remains one of the key drivers behind this move. While the RBA continues to maintain a relatively restrictive stance due to persistent inflation pressures and a resilient labor market, the BoC has shifted toward a more accommodative approach as economic growth slows. This widening policy gap continues to provide support for AUD against CAD. Institutional positioning also supports the bullish narrative. Recent COT data shows large funds increasing exposure to the Australian Dollar while maintaining a cautious outlook on the Canadian Dollar. This suggests that pullbacks are being viewed as opportunities rather than signs of trend exhaustion.
Technical Overview
Rather than chasing price near current highs, I prefer to let the market retrace into a proven area of demand where risk can be defined more effectively.
Trade Plan
Risk-to-Reward:
TP1: 1:1.38
TP2: 1:2.77
As long as price remains above the daily invalidation level, the broader bullish structure remains intact. A successful retest of the H4 support zone could provide the fuel needed for a continuation toward fresh highs.
The divergence between the RBA and the BoC remains one of the key drivers behind this move. While the RBA continues to maintain a relatively restrictive stance due to persistent inflation pressures and a resilient labor market, the BoC has shifted toward a more accommodative approach as economic growth slows. This widening policy gap continues to provide support for AUD against CAD. Institutional positioning also supports the bullish narrative. Recent COT data shows large funds increasing exposure to the Australian Dollar while maintaining a cautious outlook on the Canadian Dollar. This suggests that pullbacks are being viewed as opportunities rather than signs of trend exhaustion.
Technical Overview
- Monthly structure has broken out of a long-term accumulation range
- Weekly trend remains firmly bullish inside an ascending channel
- Daily market structure continues to print higher highs and higher lows
- Current pullback appears corrective after a strong impulsive move higher
- H4 price is approaching a key support and resistance flip zone around 0.97750
- Demand remains intact while price trades above the daily support shelf at 0.97100
Rather than chasing price near current highs, I prefer to let the market retrace into a proven area of demand where risk can be defined more effectively.
Trade Plan
- Order Type: Buy (Wait for a rejection or formation of bullish candlestick pattern)
- Entry: 0.97750
- Stop Loss: 0.97100
- TP1: 0.98650
- TP2: 0.99550
Risk-to-Reward:
TP1: 1:1.38
TP2: 1:2.77
As long as price remains above the daily invalidation level, the broader bullish structure remains intact. A successful retest of the H4 support zone could provide the fuel needed for a continuation toward fresh highs.

منشورات ذات صلة
إخلاء المسؤولية
لا يُقصد بالمعلومات والمنشورات أن تكون، أو تشكل، أي نصيحة مالية أو استثمارية أو تجارية أو أنواع أخرى من النصائح أو التوصيات المقدمة أو المعتمدة من TradingView. اقرأ المزيد في شروط الاستخدام.
منشورات ذات صلة
إخلاء المسؤولية
لا يُقصد بالمعلومات والمنشورات أن تكون، أو تشكل، أي نصيحة مالية أو استثمارية أو تجارية أو أنواع أخرى من النصائح أو التوصيات المقدمة أو المعتمدة من TradingView. اقرأ المزيد في شروط الاستخدام.