

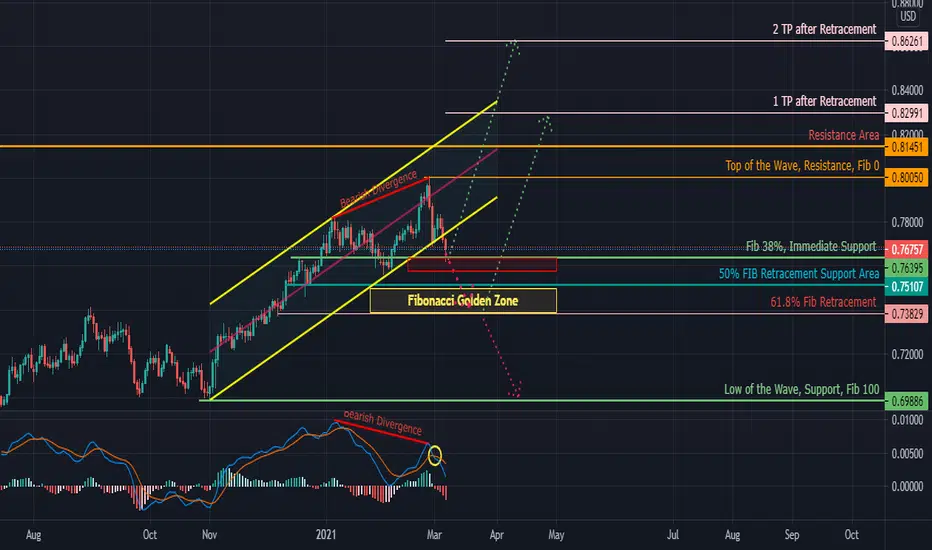
as you can see the price was centrally range bounding in an ascending parallels channel where it has shown Bearish Divergence with MACD and there exist a cross below of MACD and Signal line (in yellow Circle) on MACD Indicator, which is the sign of trend reversal, and price retracement or correction.
by using Fibonacci Retracement tool ,we can see currently the price is at 38% level and if this immediate support stands, then we can target 2TP directly, and if not, and price falls to Fibonacci Golden Zone and it stands then 1 TP is very feasible.
if fib 61.8% did not stand, then we can short it and target the low of the wave easily...
what do you think about it?
by using Fibonacci Retracement tool ,we can see currently the price is at 38% level and if this immediate support stands, then we can target 2TP directly, and if not, and price falls to Fibonacci Golden Zone and it stands then 1 TP is very feasible.
if fib 61.8% did not stand, then we can short it and target the low of the wave easily...
what do you think about it?
تم فتح الصفقة
price has touched the golden zone and now we are on the targetsتم حذف الأمر
this Instrument shall Reanalyzed and Published soon
منشورات ذات صلة
إخلاء المسؤولية
لا يُقصد بالمعلومات والمنشورات أن تكون، أو تشكل، أي نصيحة مالية أو استثمارية أو تجارية أو أنواع أخرى من النصائح أو التوصيات المقدمة أو المعتمدة من TradingView. اقرأ المزيد في شروط الاستخدام.
منشورات ذات صلة
إخلاء المسؤولية
لا يُقصد بالمعلومات والمنشورات أن تكون، أو تشكل، أي نصيحة مالية أو استثمارية أو تجارية أو أنواع أخرى من النصائح أو التوصيات المقدمة أو المعتمدة من TradingView. اقرأ المزيد في شروط الاستخدام.