

StatArb is one of the most profitable trading strategies employed by trading professionals, Hedge Funds and Proprietary Trading firms. Now the same signals are available for everyone.
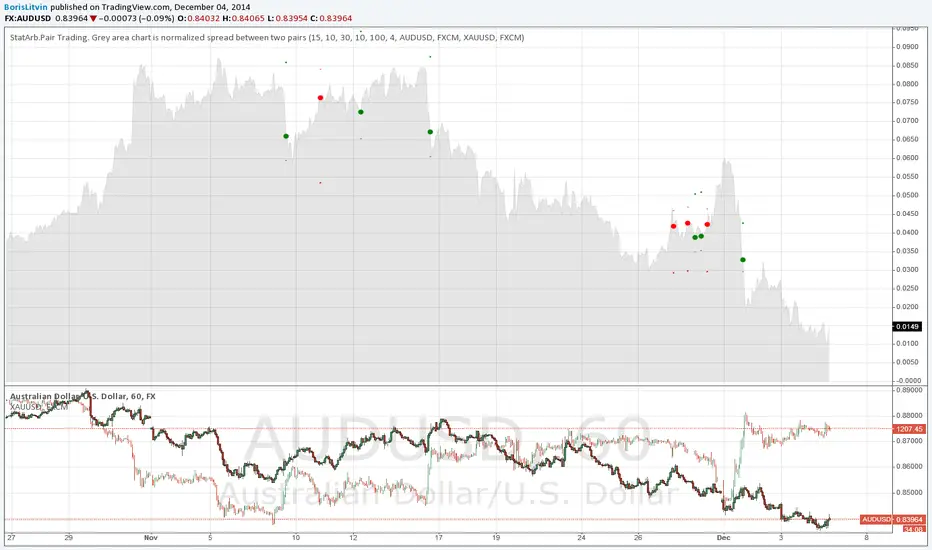
Green circle is "Buy Spread" when you buy the higher pair and sell the lower pair, red circle is the opposite. "+" and "-" are suggested stop loss and take profit levels. The grey area chart represents normalized spread between two pairs
Green circle is "Buy Spread" when you buy the higher pair and sell the lower pair, red circle is the opposite. "+" and "-" are suggested stop loss and take profit levels. The grey area chart represents normalized spread between two pairs

منشورات ذات صلة
إخلاء المسؤولية
لا يُقصد بالمعلومات والمنشورات أن تكون، أو تشكل، أي نصيحة مالية أو استثمارية أو تجارية أو أنواع أخرى من النصائح أو التوصيات المقدمة أو المعتمدة من TradingView. اقرأ المزيد في شروط الاستخدام.
منشورات ذات صلة
إخلاء المسؤولية
لا يُقصد بالمعلومات والمنشورات أن تكون، أو تشكل، أي نصيحة مالية أو استثمارية أو تجارية أو أنواع أخرى من النصائح أو التوصيات المقدمة أو المعتمدة من TradingView. اقرأ المزيد في شروط الاستخدام.