
Hello to all TradingView followers and traders 🌍📈
Hope your trades are always green and profitable 💚🔥
Today we’re taking a look at AUS200 (ASX 200), one of the most important stock market indices in Australia, which can provide a strong overview of overall market sentiment and economic conditions in the Oceania region 🇦🇺📊
This index is heavily influenced by the Reserve Bank of Australia’s policies, commodity prices, and global economic conditions 🌏⚡
That’s why AUS200 often creates attractive opportunities for short-term traders and swing traders 👀📈
AUS200 Technical Analysis 📊🔥
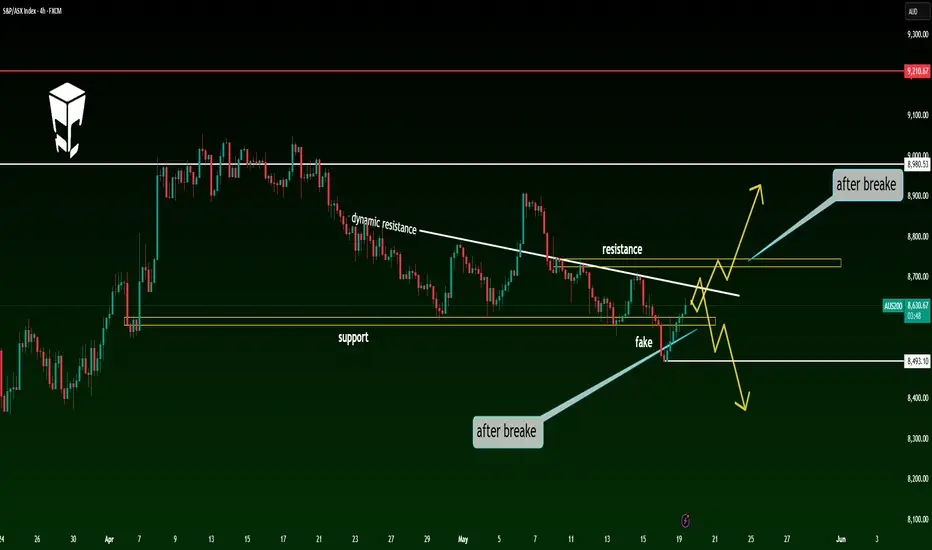
On the 4-hour timeframe, price is currently moving inside a range box structure and has now reached a key support floor ⚠️📉
One important detail is that the market previously created a fake breakout below the support zone and quickly moved back inside the range, which could indicate liquidity collection 🧠💥
At the moment, price is trying to recover, but several important resistance levels are still standing in the way 🚨
Key Chart Observations 📌
🔹 Price is currently sitting on a major 4H support zone 🟡
🔹 The range low was previously broken with a fake breakout ⚠️
🔹 The descending dynamic trendline is still acting as resistance 🔻
🔹 The marked static resistance zone is also a very important level for continuation 📈
Bullish Scenario 🚀📈
📍 If price manages to break above both the descending dynamic resistance and the marked static resistance zone, followed by confirmation and consolidation, we could see the beginning of a new bullish wave 🔥⚡
🎯 Potential upside targets:
And potentially higher levels if bullish momentum increases 📊🚀
Bearish Scenario 📉⚠️
However, if the support floor breaks again and price confirms below this zone, it could become confirmation for continued selling pressure and potential short positions 🐻🔥
📌 In that case, we will wait for bearish structure confirmation before entering the trade in order to reduce risk 🧠✅
Trading Strategy 💡
✅ Long positions after confirmed breakout above resistance levels
✅ Short positions only after a valid support breakdown
⚠️ Waiting for structure confirmation can significantly reduce risk
📌 Never ignore proper risk management
Poll 📊🤔
What’s your opinion on AUS200? 👀
🔘 Resistance will break and a bullish wave will begin 🚀
🔘 Support will fail and the market will continue lower 📉
🔘 The market will remain range-bound 🔄
Make sure to share your thoughts in the comments 💬👇
⚠️ Disclaimer
This analysis reflects personal opinion only and is not financial advice or a buy/sell signal.
Always do your own research and apply proper risk management before entering any trade. 📌
#AUS200 #ASX200 #Indices #TechnicalAnalysis #PriceAction #TradingView #Forex #SupportAndResistance #FakeBreakout #SwingTrade #MarketAnalysis #TradingSetup #Bullish #Bearish #RangeMarket
Hope your trades are always green and profitable 💚🔥
Today we’re taking a look at AUS200 (ASX 200), one of the most important stock market indices in Australia, which can provide a strong overview of overall market sentiment and economic conditions in the Oceania region 🇦🇺📊
This index is heavily influenced by the Reserve Bank of Australia’s policies, commodity prices, and global economic conditions 🌏⚡
That’s why AUS200 often creates attractive opportunities for short-term traders and swing traders 👀📈
AUS200 Technical Analysis 📊🔥
On the 4-hour timeframe, price is currently moving inside a range box structure and has now reached a key support floor ⚠️📉
One important detail is that the market previously created a fake breakout below the support zone and quickly moved back inside the range, which could indicate liquidity collection 🧠💥
At the moment, price is trying to recover, but several important resistance levels are still standing in the way 🚨
Key Chart Observations 📌
🔹 Price is currently sitting on a major 4H support zone 🟡
🔹 The range low was previously broken with a fake breakout ⚠️
🔹 The descending dynamic trendline is still acting as resistance 🔻
🔹 The marked static resistance zone is also a very important level for continuation 📈
Bullish Scenario 🚀📈
📍 If price manages to break above both the descending dynamic resistance and the marked static resistance zone, followed by confirmation and consolidation, we could see the beginning of a new bullish wave 🔥⚡
🎯 Potential upside targets:
And potentially higher levels if bullish momentum increases 📊🚀
Bearish Scenario 📉⚠️
However, if the support floor breaks again and price confirms below this zone, it could become confirmation for continued selling pressure and potential short positions 🐻🔥
📌 In that case, we will wait for bearish structure confirmation before entering the trade in order to reduce risk 🧠✅
Trading Strategy 💡
✅ Long positions after confirmed breakout above resistance levels
✅ Short positions only after a valid support breakdown
⚠️ Waiting for structure confirmation can significantly reduce risk
📌 Never ignore proper risk management
Poll 📊🤔
What’s your opinion on AUS200? 👀
🔘 Resistance will break and a bullish wave will begin 🚀
🔘 Support will fail and the market will continue lower 📉
🔘 The market will remain range-bound 🔄
Make sure to share your thoughts in the comments 💬👇
⚠️ Disclaimer
This analysis reflects personal opinion only and is not financial advice or a buy/sell signal.
Always do your own research and apply proper risk management before entering any trade. 📌
#AUS200 #ASX200 #Indices #TechnicalAnalysis #PriceAction #TradingView #Forex #SupportAndResistance #FakeBreakout #SwingTrade #MarketAnalysis #TradingSetup #Bullish #Bearish #RangeMarket

إخلاء المسؤولية
لا يُقصد بالمعلومات والمنشورات أن تكون، أو تشكل، أي نصيحة مالية أو استثمارية أو تجارية أو أنواع أخرى من النصائح أو التوصيات المقدمة أو المعتمدة من TradingView. اقرأ المزيد في شروط الاستخدام.
إخلاء المسؤولية
لا يُقصد بالمعلومات والمنشورات أن تكون، أو تشكل، أي نصيحة مالية أو استثمارية أو تجارية أو أنواع أخرى من النصائح أو التوصيات المقدمة أو المعتمدة من TradingView. اقرأ المزيد في شروط الاستخدام.