
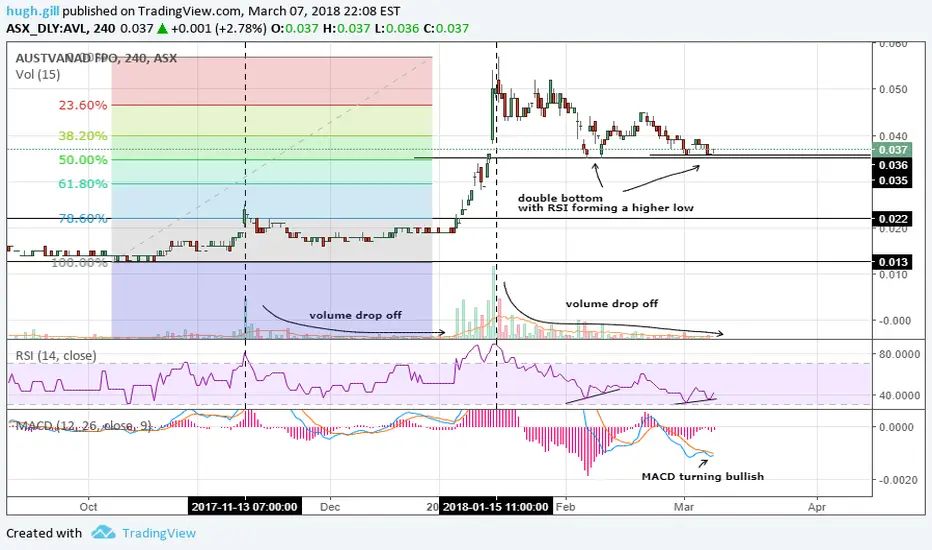
AVL has had a nice run up in price and has recently pulled back about 40% before finding support on the 50% FIB level..
Bullish Indicators:
Double Bottom on 50% Fib
Higher Low on 50% Fib
RSI creating higher low on 4 hour chart (showing strength)
Monthly RSI cooled off.
Volume has dropped off significantly. (usually see this before a big pump)
I noticed this exact set up on another chart KRC screenshot below

Entry .036 - .037
Target .065
Stoploss .034
Stoploss
Bullish Indicators:
Double Bottom on 50% Fib
Higher Low on 50% Fib
RSI creating higher low on 4 hour chart (showing strength)
Monthly RSI cooled off.
Volume has dropped off significantly. (usually see this before a big pump)
I noticed this exact set up on another chart KRC screenshot below
Entry .036 - .037
Target .065
Stoploss .034
Stoploss
تم فتح الصفقة
KRC Weekly RSI CooloffAVL Weekly RSI Cooloff

منشورات ذات صلة
إخلاء المسؤولية
لا يُقصد بالمعلومات والمنشورات أن تكون، أو تشكل، أي نصيحة مالية أو استثمارية أو تجارية أو أنواع أخرى من النصائح أو التوصيات المقدمة أو المعتمدة من TradingView. اقرأ المزيد في شروط الاستخدام.
إخلاء المسؤولية
لا يُقصد بالمعلومات والمنشورات أن تكون، أو تشكل، أي نصيحة مالية أو استثمارية أو تجارية أو أنواع أخرى من النصائح أو التوصيات المقدمة أو المعتمدة من TradingView. اقرأ المزيد في شروط الاستخدام.