
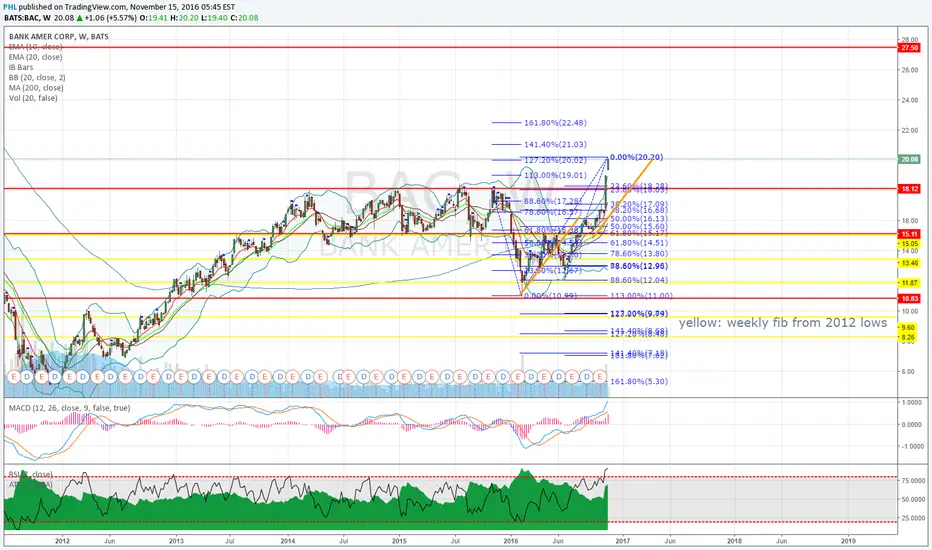
So we finally broke out to multi-year highs. Now what?
In the short-term, some critical points on the chart suggest to take some profit:
- If we take an equal-measured move from the yearly lows at 10.99 to the August highs and copy that move from September lows we can see that we end up right where we are now (20.08, see orange lines).
- If we measure a fib inversion from Nov 2015 highs to the 2016 lows, we get a 127.2% extension which aligns well with where we are now (20.02).
- Weekly RSI violently overbought at 91.63 (!!!)
So I exited some of my positions which I partially will rebuild if we get a retracement into the 15s. Should this break-out continue to go higher, I will gladly sell my core position at the next weekly resistance level around 27.50
In the short-term, some critical points on the chart suggest to take some profit:
- If we take an equal-measured move from the yearly lows at 10.99 to the August highs and copy that move from September lows we can see that we end up right where we are now (20.08, see orange lines).
- If we measure a fib inversion from Nov 2015 highs to the 2016 lows, we get a 127.2% extension which aligns well with where we are now (20.02).
- Weekly RSI violently overbought at 91.63 (!!!)
So I exited some of my positions which I partially will rebuild if we get a retracement into the 15s. Should this break-out continue to go higher, I will gladly sell my core position at the next weekly resistance level around 27.50

إخلاء المسؤولية
لا يُقصد بالمعلومات والمنشورات أن تكون، أو تشكل، أي نصيحة مالية أو استثمارية أو تجارية أو أنواع أخرى من النصائح أو التوصيات المقدمة أو المعتمدة من TradingView. اقرأ المزيد في شروط الاستخدام.
إخلاء المسؤولية
لا يُقصد بالمعلومات والمنشورات أن تكون، أو تشكل، أي نصيحة مالية أو استثمارية أو تجارية أو أنواع أخرى من النصائح أو التوصيات المقدمة أو المعتمدة من TradingView. اقرأ المزيد في شروط الاستخدام.