
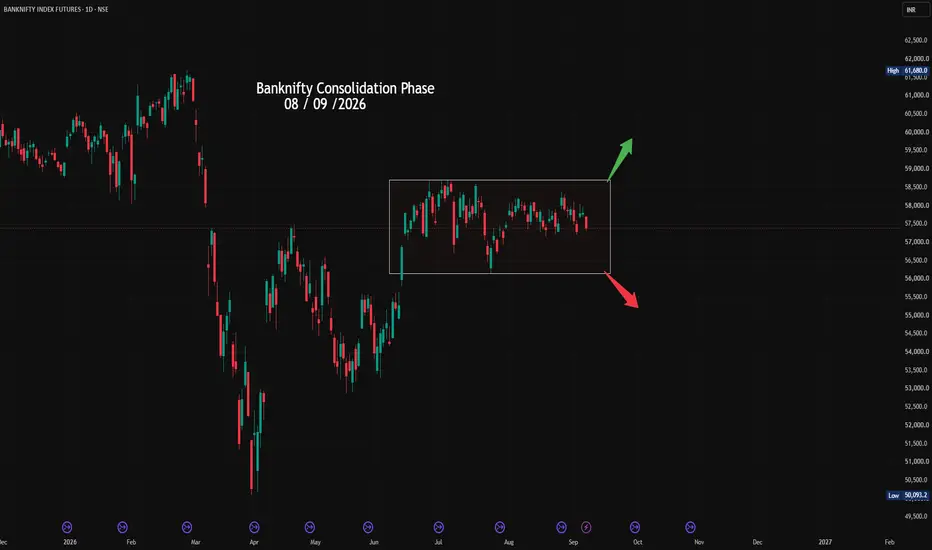
NSE India : Banknifty Daily chart Analyses
Bank Nifty Consolidation Phase and Structural Integrity: For the last 4 months, Bank Nifty has traded within a range, with a high of 58,650 and a low of 56,200
🔴 Major Resistance: 58,650
58,650 is the upper boundary of the established distribution/consolidation zone.
• Price has repeatedly approached this region without sustaining a breakout.
• Repeated rejection around this area indicates significant overhead supply.
• The upper boundary therefore acts as the key bullish trigger zone.
• A brief intraday penetration above 58,650 should not automatically be treated
as a breakout.
• The stronger confirmation would be a daily close above the zone, preferably accompanied
by expanding volume and follow-through.
🔴 Major Support: 56,200
56,200 is the primary lower boundary of the range and the critical demand/support zone.
• Previous reactions from this area establish its importance.
• Failure to hold this level would damage the current range structure.
• A decisive daily close below 56,200 would shift the market from range-bound → bearish
structural expansion.
Middle of range = (High range + Low Range)/ 2
(58,650 + 56,200) / 2 = 57,425
Current price is around 57,370, meaning Bank Nifty is almost exactly at the range equilibrium.
Bank Nifty Consolidation Phase and Structural Integrity: For the last 4 months, Bank Nifty has traded within a range, with a high of 58,650 and a low of 56,200
🔴 Major Resistance: 58,650
58,650 is the upper boundary of the established distribution/consolidation zone.
• Price has repeatedly approached this region without sustaining a breakout.
• Repeated rejection around this area indicates significant overhead supply.
• The upper boundary therefore acts as the key bullish trigger zone.
• A brief intraday penetration above 58,650 should not automatically be treated
as a breakout.
• The stronger confirmation would be a daily close above the zone, preferably accompanied
by expanding volume and follow-through.
🔴 Major Support: 56,200
56,200 is the primary lower boundary of the range and the critical demand/support zone.
• Previous reactions from this area establish its importance.
• Failure to hold this level would damage the current range structure.
• A decisive daily close below 56,200 would shift the market from range-bound → bearish
structural expansion.
Middle of range = (High range + Low Range)/ 2
(58,650 + 56,200) / 2 = 57,425
Current price is around 57,370, meaning Bank Nifty is almost exactly at the range equilibrium.

Website : ai-indicator.com WhatsApp : +919270007010
Telegram : t.me/+sgyahAbjk3YzYWJl
mail Id : satyambeed@gmail.com
Telegram : t.me/+sgyahAbjk3YzYWJl
mail Id : satyambeed@gmail.com
إخلاء المسؤولية
لا يُقصد بالمعلومات والمنشورات أن تكون، أو تشكل، أي نصيحة مالية أو استثمارية أو تجارية أو أنواع أخرى من النصائح أو التوصيات المقدمة أو المعتمدة من TradingView. اقرأ المزيد في شروط الاستخدام.
Website : ai-indicator.com WhatsApp : +919270007010
Telegram : t.me/+sgyahAbjk3YzYWJl
mail Id : satyambeed@gmail.com
Telegram : t.me/+sgyahAbjk3YzYWJl
mail Id : satyambeed@gmail.com
إخلاء المسؤولية
لا يُقصد بالمعلومات والمنشورات أن تكون، أو تشكل، أي نصيحة مالية أو استثمارية أو تجارية أو أنواع أخرى من النصائح أو التوصيات المقدمة أو المعتمدة من TradingView. اقرأ المزيد في شروط الاستخدام.