
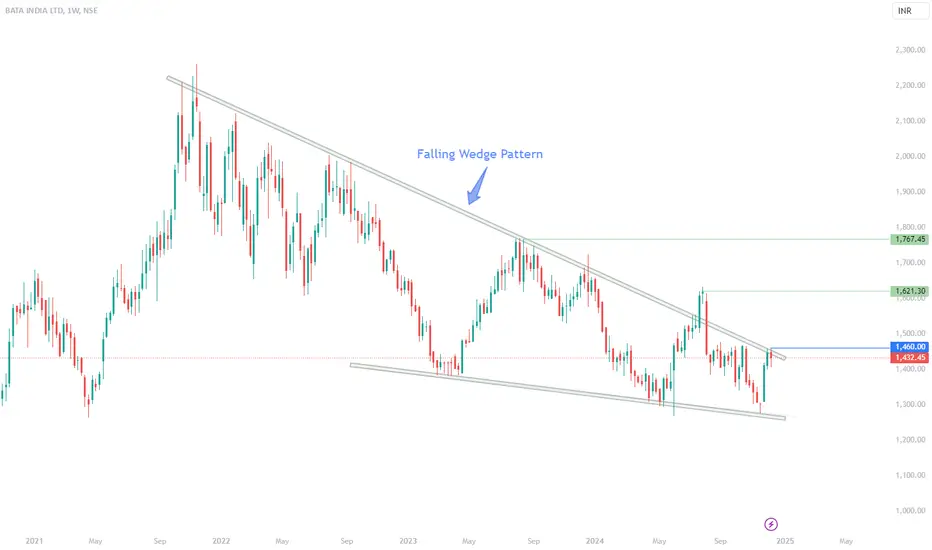
Weekly chart of BATA shows a beautiful Falling Wedge pattern.
The last candle is an inside candle from the previous week, suggesting a brief pause before the up move.
Any break above 1460 can result in a good move on the upside.
Fall below 1400 may be a continuation of the falling wedge pattern.
The last candle is an inside candle from the previous week, suggesting a brief pause before the up move.
Any break above 1460 can result in a good move on the upside.
Fall below 1400 may be a continuation of the falling wedge pattern.

إخلاء المسؤولية
لا يُقصد بالمعلومات والمنشورات أن تكون، أو تشكل، أي نصيحة مالية أو استثمارية أو تجارية أو أنواع أخرى من النصائح أو التوصيات المقدمة أو المعتمدة من TradingView. اقرأ المزيد في شروط الاستخدام.
إخلاء المسؤولية
لا يُقصد بالمعلومات والمنشورات أن تكون، أو تشكل، أي نصيحة مالية أو استثمارية أو تجارية أو أنواع أخرى من النصائح أو التوصيات المقدمة أو المعتمدة من TradingView. اقرأ المزيد في شروط الاستخدام.