
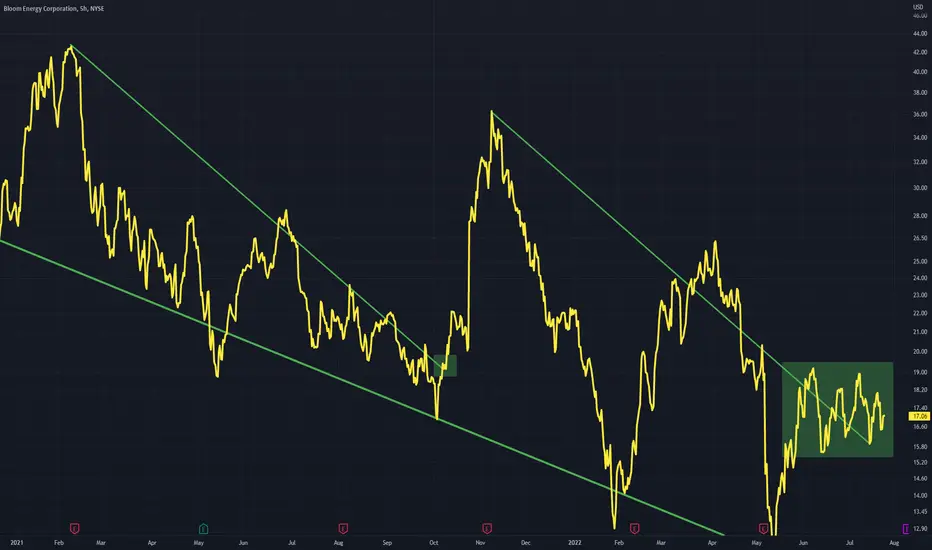
Two falling wedges can be drawn on chart
The first showing a successful breakout, leading to the peak of the second falling wedge
This second falling wedge may not have bottomed but the break out should occur along the green downtrend line
The first showing a successful breakout, leading to the peak of the second falling wedge
This second falling wedge may not have bottomed but the break out should occur along the green downtrend line

إخلاء المسؤولية
لا يُقصد بالمعلومات والمنشورات أن تكون، أو تشكل، أي نصيحة مالية أو استثمارية أو تجارية أو أنواع أخرى من النصائح أو التوصيات المقدمة أو المعتمدة من TradingView. اقرأ المزيد في شروط الاستخدام.
إخلاء المسؤولية
لا يُقصد بالمعلومات والمنشورات أن تكون، أو تشكل، أي نصيحة مالية أو استثمارية أو تجارية أو أنواع أخرى من النصائح أو التوصيات المقدمة أو المعتمدة من TradingView. اقرأ المزيد في شروط الاستخدام.