BlackRock ( BLK): Symmetrical Triangle Compression – Range Inefficient Trading vs. Macro Breakout Vectors
### 💼 BlackRock Inc. (BLK) Daily Technical Framework (Ref: BLK_2026-06-17_10-12-33.png)
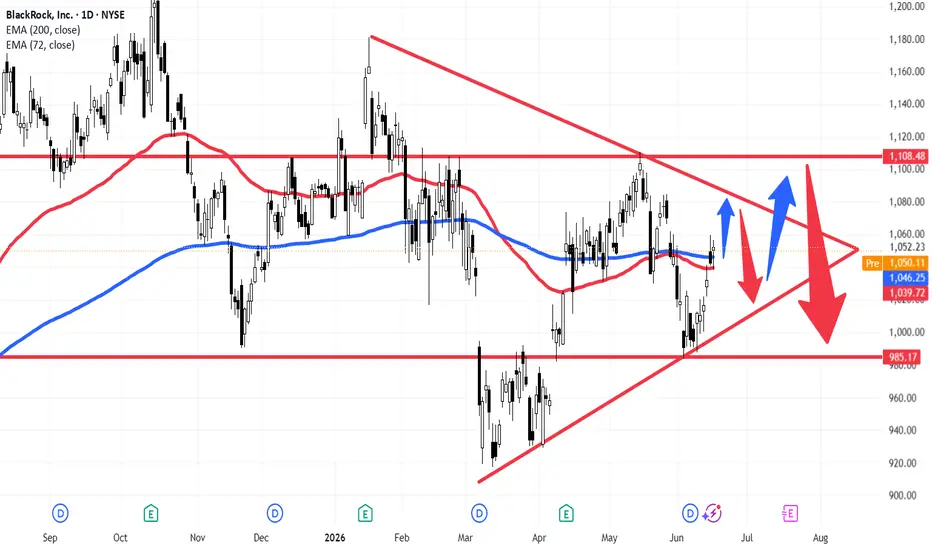
We are tracking a highly defined, multi-month structural compression pattern on BlackRock Inc. (BLK - NYSE) on the Daily (1D) chart.
The stock concluded its last formal session up **+0.29% at 1,052.23**, with pre-market data prints hovering slightly lower near **1,050.11**. Price action is now deeply locked inside a massive, tightening **Symmetrical Triangle** framework, which is developing within a broader macro consolidation trading range.
---
### 🔍 Structural Geometry & Cluster Confluence:
1. **The Overhead Descending Trendline (LTB):** Connecting the structural lower highs since the January peaks. Price is currently expanding upward toward a retest of this diagonal supply barrier (as indicated by the immediate blue arrow).
2. **The Lower Ascending Trendline (LTA):** Formed by the consecutive higher lows established since March, providing a reliable demand floor for swing long positions.
3. **The Exponential Moving Average Cluster:** Both the long-term **200-period EMA (blue line at 1,046.25)** and the intermediate **72-period EMA (red line at 1,039.72)** have completely flattened out and entangled. This behavior is a textbook indicator of a non-trending, highly compressed market equilibrium where moving averages act as an axis rather than a dynamic trend guide.
4. **The Macro Range Limits:** The overall accumulation block is heavily defined by two major horizontal boundaries: resistance supply at **1,108.48** and a key historical demand floor at **985.17**.
---
### ⚡ Operational Playbook: Two-Phase Execution
* **Phase 1: Inside-the-Range Mean Reversion (Immediate Setup)**
As long as the price remains bound within the converging boundaries of the triangle, the optimal strategy focuses on range-bound execution. Traders can look to deploy capital to short/sell near the upper diagonal LTB and buy/long near the lower diagonal LTA, capturing the rotational waves (noted by the alternating blue and red internal vectors).
* **Phase 2: The Apex Volatility Expansion (The Breakout Setup)**
As the price action pushes closer to the apex of the triangle, volatility will inevitably collapse before exploding into a directional expansion. We must maintain high alertness for a decisive daily candle close outside either trendline boundary:
* **Upside Escape:** A clean breakout above the LTB opens a rapid liquidity pocket to test the **1,108.48** macro ceiling.
* **Downside Escape:** A breakdown below the LTA (as projected by the large red extension arrow near the apex) will signal a major institutional distribution phase, paving the way for a sharp wave downward into the crucial macro baseline support floor at **985.17**.
### Summary:
Trade the boundaries with tight risk definitions for now, but save core allocation capacity for the ultimate breakout confirmation.
---
📊 **ChartPro Data** | By Rogerio Zaglia
*Institutional Asset Research, Geometric Compression & Systematic Range Management.*
⚠️ **Disclaimer:** For educational and informational purposes only. This technical analysis represents a personal trading framework and does not constitute financial or investment advice.
BLK): Symmetrical Triangle Compression – Range Inefficient Trading vs. Macro Breakout Vectors### 💼 BlackRock Inc. (
BLK) Daily Technical Framework (Ref: BLK_2026-06-17_10-12-33.png)We are tracking a highly defined, multi-month structural compression pattern on BlackRock Inc. (
BLK - NYSE) on the Daily (1D) chart. The stock concluded its last formal session up **+0.29% at 1,052.23**, with pre-market data prints hovering slightly lower near **1,050.11**. Price action is now deeply locked inside a massive, tightening **Symmetrical Triangle** framework, which is developing within a broader macro consolidation trading range.
---
### 🔍 Structural Geometry & Cluster Confluence:
1. **The Overhead Descending Trendline (LTB):** Connecting the structural lower highs since the January peaks. Price is currently expanding upward toward a retest of this diagonal supply barrier (as indicated by the immediate blue arrow).
2. **The Lower Ascending Trendline (LTA):** Formed by the consecutive higher lows established since March, providing a reliable demand floor for swing long positions.
3. **The Exponential Moving Average Cluster:** Both the long-term **200-period EMA (blue line at 1,046.25)** and the intermediate **72-period EMA (red line at 1,039.72)** have completely flattened out and entangled. This behavior is a textbook indicator of a non-trending, highly compressed market equilibrium where moving averages act as an axis rather than a dynamic trend guide.
4. **The Macro Range Limits:** The overall accumulation block is heavily defined by two major horizontal boundaries: resistance supply at **1,108.48** and a key historical demand floor at **985.17**.
---
### ⚡ Operational Playbook: Two-Phase Execution
* **Phase 1: Inside-the-Range Mean Reversion (Immediate Setup)**
As long as the price remains bound within the converging boundaries of the triangle, the optimal strategy focuses on range-bound execution. Traders can look to deploy capital to short/sell near the upper diagonal LTB and buy/long near the lower diagonal LTA, capturing the rotational waves (noted by the alternating blue and red internal vectors).
* **Phase 2: The Apex Volatility Expansion (The Breakout Setup)**
As the price action pushes closer to the apex of the triangle, volatility will inevitably collapse before exploding into a directional expansion. We must maintain high alertness for a decisive daily candle close outside either trendline boundary:
* **Upside Escape:** A clean breakout above the LTB opens a rapid liquidity pocket to test the **1,108.48** macro ceiling.
* **Downside Escape:** A breakdown below the LTA (as projected by the large red extension arrow near the apex) will signal a major institutional distribution phase, paving the way for a sharp wave downward into the crucial macro baseline support floor at **985.17**.
### Summary:
Trade the boundaries with tight risk definitions for now, but save core allocation capacity for the ultimate breakout confirmation.
---
📊 **ChartPro Data** | By Rogerio Zaglia
*Institutional Asset Research, Geometric Compression & Systematic Range Management.*
⚠️ **Disclaimer:** For educational and informational purposes only. This technical analysis represents a personal trading framework and does not constitute financial or investment advice.

إخلاء المسؤولية
لا يُقصد بالمعلومات والمنشورات أن تكون، أو تشكل، أي نصيحة مالية أو استثمارية أو تجارية أو أنواع أخرى من النصائح أو التوصيات المقدمة أو المعتمدة من TradingView. اقرأ المزيد في شروط الاستخدام.
إخلاء المسؤولية
لا يُقصد بالمعلومات والمنشورات أن تكون، أو تشكل، أي نصيحة مالية أو استثمارية أو تجارية أو أنواع أخرى من النصائح أو التوصيات المقدمة أو المعتمدة من TradingView. اقرأ المزيد في شروط الاستخدام.