
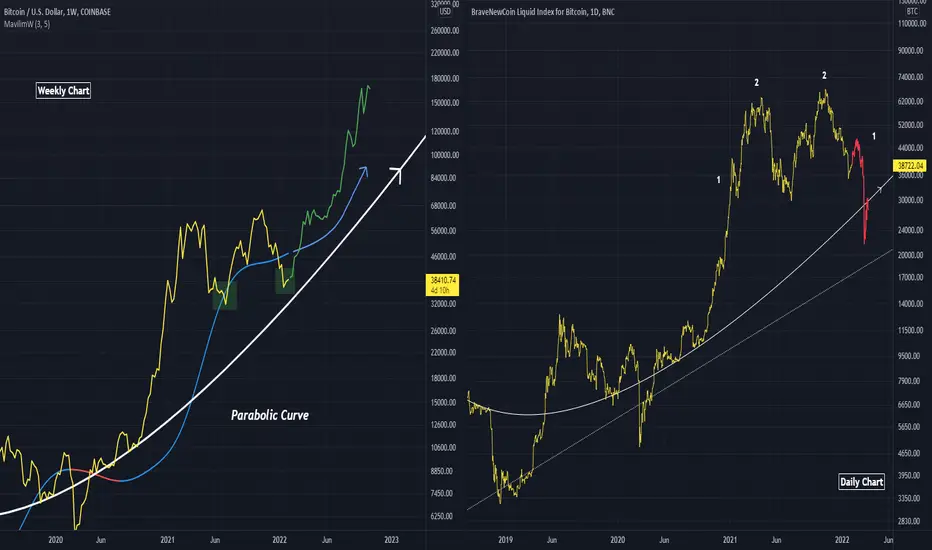
On the left I assume the Parabolic trend hodls, coupled with a double bottom , leading to price increase on the Weekly timeframe
On the right I assume a third breakdown under the same Parabolic trend occurs, as indicated by (1). This provides symmetry for the current formation and allows for the third dip.
Red pill, blue pill
On the right I assume a third breakdown under the same Parabolic trend occurs, as indicated by (1). This provides symmetry for the current formation and allows for the third dip.
Red pill, blue pill
ملاحظة
The suggested peak (bars pattern) on the bull chart could just be the initial spike on the (1) move for the bears
إخلاء المسؤولية
لا يُقصد بالمعلومات والمنشورات أن تكون، أو تشكل، أي نصيحة مالية أو استثمارية أو تجارية أو أنواع أخرى من النصائح أو التوصيات المقدمة أو المعتمدة من TradingView. اقرأ المزيد في شروط الاستخدام.
إخلاء المسؤولية
لا يُقصد بالمعلومات والمنشورات أن تكون، أو تشكل، أي نصيحة مالية أو استثمارية أو تجارية أو أنواع أخرى من النصائح أو التوصيات المقدمة أو المعتمدة من TradingView. اقرأ المزيد في شروط الاستخدام.