
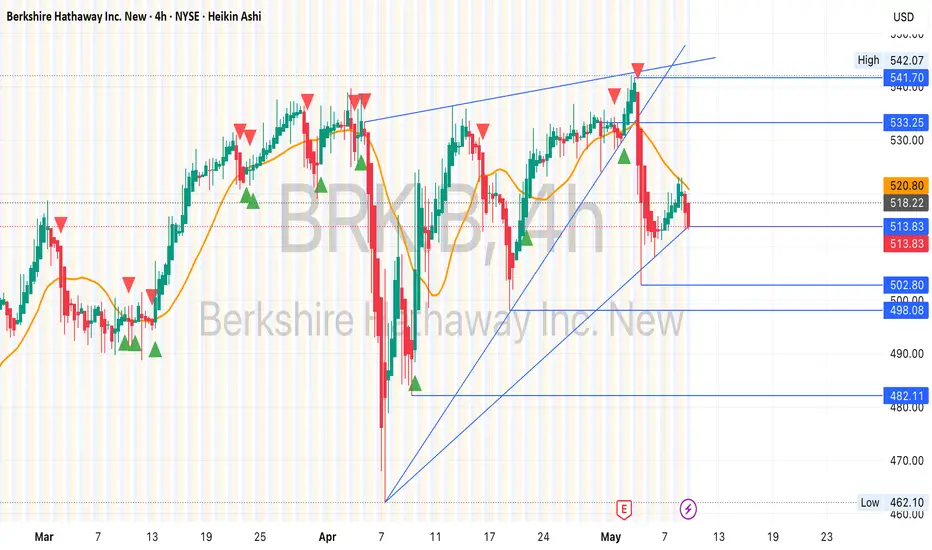
BRK.B 4H Chart Technical Analysis
Trend Context:
The chart shows Berkshire Hathaway (BRK.B) on the 4H timeframe using Heikin Ashi candles. The stock was previously in an ascending channel but has broken below the lower trendline—signaling a potential shift in momentum.
Bearish Signs:
🔻 Channel Breakdown: Price has broken below the rising trendline support, invalidating the prior bullish structure.
🔻 Failed to Hold $520.80 Resistance: The recent bounce failed to sustain above this level.
🔻 Bearish Heikin Ashi Candles: Consecutive red candles with no upper wicks indicate strong downside pressure.
🔻 Bearish EMA Crossover: The orange moving average (likely 9 or 21 EMA) is curling down, which often precedes further downside.
Support & Target Zones:
Immediate support: $513.80 — currently being tested.
Break below this could lead to:
$502.80
$498.08
$482.11
$462.10 (critical swing low)
Bullish Reclaim Needed:
Bulls must reclaim and hold above $520.80, followed by a break above $533.25 to reestablish a bullish bias.
Until then, momentum favors the bears.

إخلاء المسؤولية
لا يُقصد بالمعلومات والمنشورات أن تكون، أو تشكل، أي نصيحة مالية أو استثمارية أو تجارية أو أنواع أخرى من النصائح أو التوصيات المقدمة أو المعتمدة من TradingView. اقرأ المزيد في شروط الاستخدام.
إخلاء المسؤولية
لا يُقصد بالمعلومات والمنشورات أن تكون، أو تشكل، أي نصيحة مالية أو استثمارية أو تجارية أو أنواع أخرى من النصائح أو التوصيات المقدمة أو المعتمدة من TradingView. اقرأ المزيد في شروط الاستخدام.