
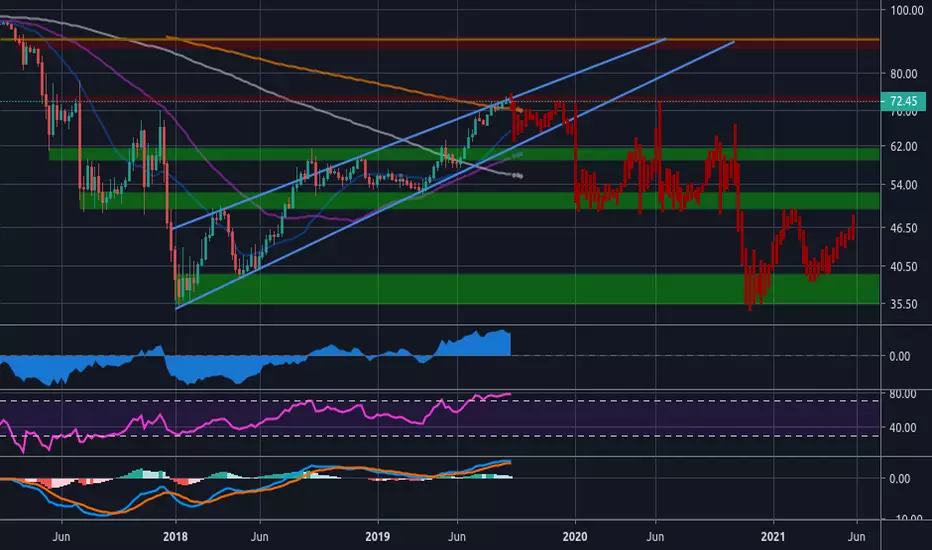
- Each trendline has three points of contact and are logarithmically getting closer together: rising wedge pattern.
- BTC Dominance beginning to look overextended (TD) and overbought (RSI) while testing resistance between 72-74%.
- This is far from a perfect rising wedge as it excludes the September 2018 head fake, but a theory worth considering.
- BTC.D closed above it's 200 Week MA (70.5%) for the first time ever last month. A close below could be fatal.
- Currently expecting a January 2020 "mini altseason" with full-blown altseason in Winter 2021.
ملاحظة
BTC dominance broken through local support on the 4hr, current retesting it. The doji reversal on the week of 2nd sept is what I've been paying attention to.ملاحظة
BTC dominance fell through 4hr support around 71.6%, now it's heading for the daily/weekly support area around 69.6%-70.3%. Expecting a reaction from the 200 Week MA (golden line), but ultimately for support to break. Notice how this moving average is still moving downhill, as in the macro sense BTC.D is still bearish.ملاحظة
ملاحظة
No reaction from 50 Day MA yet? Heading straight to 70 by looks of it.ملاحظة
Now at critical levels. BTC dominance has made a new lower low of 69.33%, now retesting prior low of 69.6%.تم فتح الصفقة
I'm now analyzing the altcoin dominance chart instead for a better bullish view. For anyone looking its 1-BTC+99.
ملاحظة
Dominance falling as expected, even if not as aggressively as first thought.Price is now within the forecasted bars again :-)

إخلاء المسؤولية
لا يُقصد بالمعلومات والمنشورات أن تكون، أو تشكل، أي نصيحة مالية أو استثمارية أو تجارية أو أنواع أخرى من النصائح أو التوصيات المقدمة أو المعتمدة من TradingView. اقرأ المزيد في شروط الاستخدام.
إخلاء المسؤولية
لا يُقصد بالمعلومات والمنشورات أن تكون، أو تشكل، أي نصيحة مالية أو استثمارية أو تجارية أو أنواع أخرى من النصائح أو التوصيات المقدمة أو المعتمدة من TradingView. اقرأ المزيد في شروط الاستخدام.