
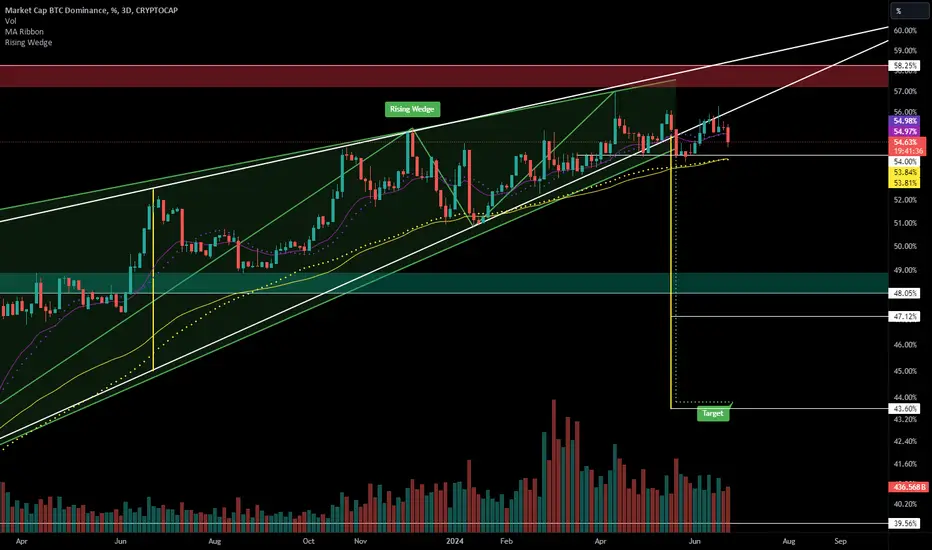
3-daily chart for BTC.D
Targets:
Prereqs:
Some confluence:
Daily line chart view:

Targets:
- Possible drop to support support initially.
- Then TP 1 around 47
- TP 2 ~43-44%.
Prereqs:
Remain below the wedge and lose 54% and then the 200 day EMA/MA just under it.
Some confluence:
My hand-drawn rising wedge on the log chart above has a measured TP 2 that lines up almost perfectly with the linear chart's "Rising Wedge" auto-pattern indicator.
Daily line chart view:

إخلاء المسؤولية
لا يُقصد بالمعلومات والمنشورات أن تكون، أو تشكل، أي نصيحة مالية أو استثمارية أو تجارية أو أنواع أخرى من النصائح أو التوصيات المقدمة أو المعتمدة من TradingView. اقرأ المزيد في شروط الاستخدام.
إخلاء المسؤولية
لا يُقصد بالمعلومات والمنشورات أن تكون، أو تشكل، أي نصيحة مالية أو استثمارية أو تجارية أو أنواع أخرى من النصائح أو التوصيات المقدمة أو المعتمدة من TradingView. اقرأ المزيد في شروط الاستخدام.