
Hello
It's a Bitcoin Guide.
My analysis is optimized for TradingView.
If you press the Replay button, you can check real-time movements.

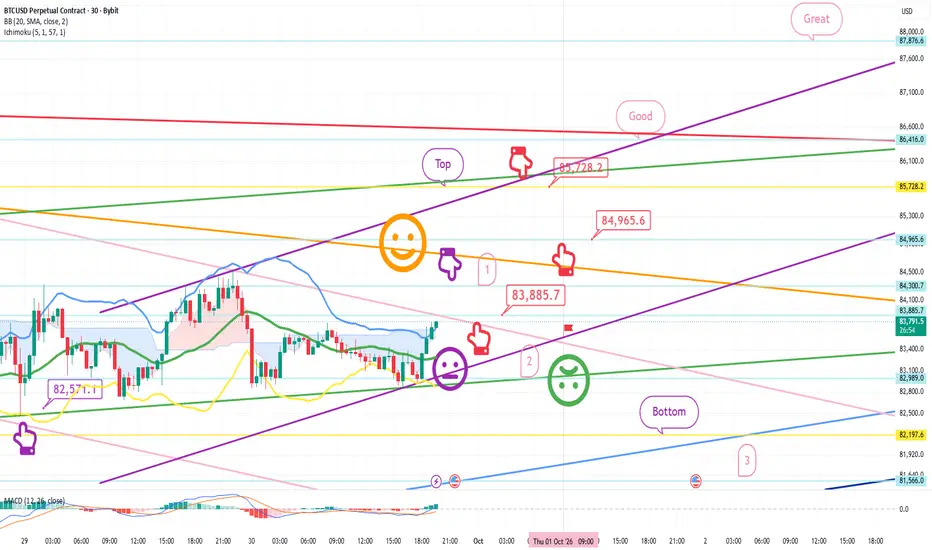
This is the Bitcoin 30-minute chart.
At the bottom left, indicated by a purple finger,
I have maintained the strategy for the long position entered on the 28th at $82,571.1.
*Long position strategy regarding the touch of the area marked by purple finger #1 at the top:
1) After confirming a touch on the area marked by purple finger #1 at the top,
look for a long entry at the level marked by the red finger ($83,885.7)
/ Stop-loss if the green support line is breached.
2) Top target area: $85,728.2 (1st target) -> Targets follow the sequence of "Good" then "Great."
If the strategy succeeds, the 84.9K level serves as a zone for re-entering a long position.
3) If the price drops without touching the area marked by purple finger #1,
wait for a long entry at the bottom area marked #1 / Stop-loss if the green support line is breached.
The same stop-loss level applies to those currently holding the 82.5K long position.
- Although the probability is very low before the new monthly candle forms tomorrow,
if the "Great" target is touched, a strong upward trend could continue.
This would increase the likelihood of hitting a new all-time high by the end of the year.
- If the price holds without breaking below the purple parallel lines,
there is a possibility of a vertical or strong upward surge.
- If the green support line is breached,
be aware that the price could drop toward the "Bottom" area—potentially down to the 3rd zone.
Please use this analysis solely for reference and planning purposes,
and ensure you trade safely by adhering to your principles and using stop-loss orders.
Thank you.
It's a Bitcoin Guide.
My analysis is optimized for TradingView.
If you press the Replay button, you can check real-time movements.
This is the Bitcoin 30-minute chart.
At the bottom left, indicated by a purple finger,
I have maintained the strategy for the long position entered on the 28th at $82,571.1.
*Long position strategy regarding the touch of the area marked by purple finger #1 at the top:
1) After confirming a touch on the area marked by purple finger #1 at the top,
look for a long entry at the level marked by the red finger ($83,885.7)
/ Stop-loss if the green support line is breached.
2) Top target area: $85,728.2 (1st target) -> Targets follow the sequence of "Good" then "Great."
If the strategy succeeds, the 84.9K level serves as a zone for re-entering a long position.
3) If the price drops without touching the area marked by purple finger #1,
wait for a long entry at the bottom area marked #1 / Stop-loss if the green support line is breached.
The same stop-loss level applies to those currently holding the 82.5K long position.
- Although the probability is very low before the new monthly candle forms tomorrow,
if the "Great" target is touched, a strong upward trend could continue.
This would increase the likelihood of hitting a new all-time high by the end of the year.
- If the price holds without breaking below the purple parallel lines,
there is a possibility of a vertical or strong upward surge.
- If the green support line is breached,
be aware that the price could drop toward the "Bottom" area—potentially down to the 3rd zone.
Please use this analysis solely for reference and planning purposes,
and ensure you trade safely by adhering to your principles and using stop-loss orders.
Thank you.
تم فتح الصفقة
Hello,This is Bitcoin Guide.
Let’s review the price movement since the analysis post on September 30th.
This is the Bitcoin 30-minute chart.
I have marked key zones with black arrows.
At the bottom left, indicated by a purple arrow, I have carried over the strategy from the long position entry point of $82,571.1 established on September 28th.
*After touching "Zone 1" (marked with a purple arrow) at the top—
following the long position strategy marked with a red arrow—
the price rebounded strongly from Zone 1 to the "Top" target level.
Subsequently, after the long position entry at $83,885.7 (at the bottom),
the market closed with a sideways trend sloping slightly downward.
A new monthly candle has formed,
and a minor rebound followed by a correction is currently underway.
The price is moving sideways within the convergence zone between the orange resistance line and the green support line.
I will mark the strategy as "active"—maintaining the long position at the $83.8K level—
and then outline today's strategy.
Although the market has been moving sideways recently,
the price reached the upper target level identified in the September 28th analysis,
so I will proceed to take profit.
I’ll see you again shortly.
Thank you.

[Bitcoin Guide Affiliate]
*Bybit 20%DC Lifetime + $30,100
partner.bybit.com/b/Bitcoin_Guide
*BingX 50%DC + $14,100
bit.ly/3E8ZkAW
*ZeroMarket ECN 40%DC
bit.ly/3pY0dUv
*Telegram
t.me/bitcoinguide_TM
*Bybit 20%DC Lifetime + $30,100
partner.bybit.com/b/Bitcoin_Guide
*BingX 50%DC + $14,100
bit.ly/3E8ZkAW
*ZeroMarket ECN 40%DC
bit.ly/3pY0dUv
*Telegram
t.me/bitcoinguide_TM
منشورات ذات صلة
إخلاء المسؤولية
لا يُقصد بالمعلومات والمنشورات أن تكون، أو تشكل، أي نصيحة مالية أو استثمارية أو تجارية أو أنواع أخرى من النصائح أو التوصيات المقدمة أو المعتمدة من TradingView. اقرأ المزيد في شروط الاستخدام.
[Bitcoin Guide Affiliate]
*Bybit 20%DC Lifetime + $30,100
partner.bybit.com/b/Bitcoin_Guide
*BingX 50%DC + $14,100
bit.ly/3E8ZkAW
*ZeroMarket ECN 40%DC
bit.ly/3pY0dUv
*Telegram
t.me/bitcoinguide_TM
*Bybit 20%DC Lifetime + $30,100
partner.bybit.com/b/Bitcoin_Guide
*BingX 50%DC + $14,100
bit.ly/3E8ZkAW
*ZeroMarket ECN 40%DC
bit.ly/3pY0dUv
*Telegram
t.me/bitcoinguide_TM
منشورات ذات صلة
إخلاء المسؤولية
لا يُقصد بالمعلومات والمنشورات أن تكون، أو تشكل، أي نصيحة مالية أو استثمارية أو تجارية أو أنواع أخرى من النصائح أو التوصيات المقدمة أو المعتمدة من TradingView. اقرأ المزيد في شروط الاستخدام.