
So this is my first published chart work on Trading View.
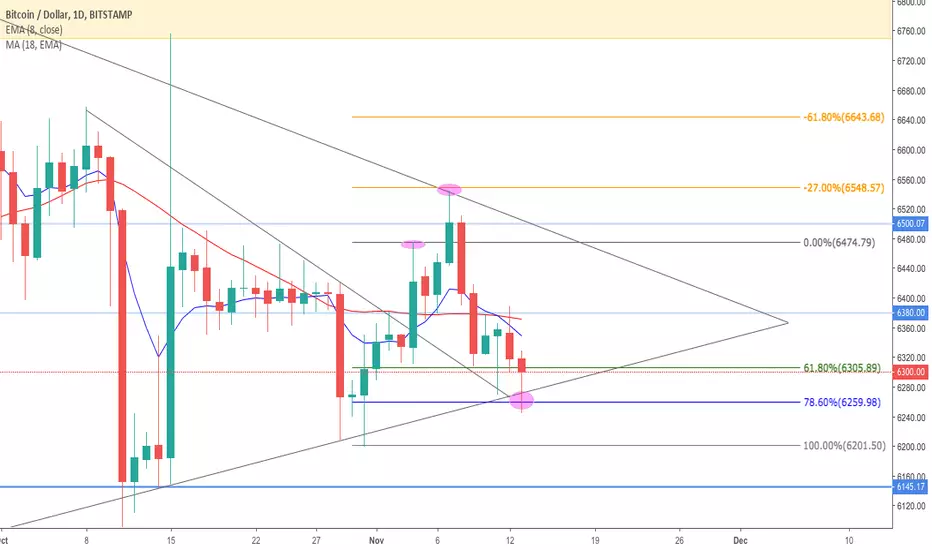
Using the fibonacci tool, I see the price action hit the 0.0% on 11/4 and then spiked close to the -27.0% on 11/7
Then after dropping down to the 61.80% and testing that zone for a couple of days before a spike down to the 78.6%
all while pretty much respecting the trend line and counter-trend lines.
So we should close the day right around $6305 (61.8-% FIB) and then attempt to move slightly higher to the $6380-$6400 region to align with the 18EMA
Let me know your feedback on how you think I did or what areas I can improve.
Using the fibonacci tool, I see the price action hit the 0.0% on 11/4 and then spiked close to the -27.0% on 11/7
Then after dropping down to the 61.80% and testing that zone for a couple of days before a spike down to the 78.6%
all while pretty much respecting the trend line and counter-trend lines.
So we should close the day right around $6305 (61.8-% FIB) and then attempt to move slightly higher to the $6380-$6400 region to align with the 18EMA
Let me know your feedback on how you think I did or what areas I can improve.

إخلاء المسؤولية
لا يُقصد بالمعلومات والمنشورات أن تكون، أو تشكل، أي نصيحة مالية أو استثمارية أو تجارية أو أنواع أخرى من النصائح أو التوصيات المقدمة أو المعتمدة من TradingView. اقرأ المزيد في شروط الاستخدام.
إخلاء المسؤولية
لا يُقصد بالمعلومات والمنشورات أن تكون، أو تشكل، أي نصيحة مالية أو استثمارية أو تجارية أو أنواع أخرى من النصائح أو التوصيات المقدمة أو المعتمدة من TradingView. اقرأ المزيد في شروط الاستخدام.