
Lower-timeframe, might signal contrary to bigger reversal than the 'continuation' uptrend.
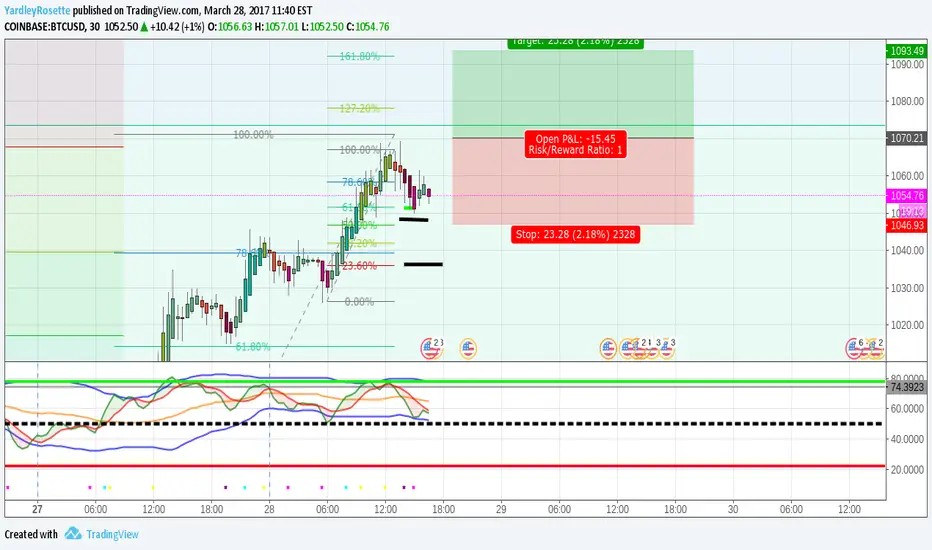
2-Hour chart signals a soon possible downward [SHORT] reversal. Contrary to posted idea [See IMAGE below]
I set a Fibonacci within a major Fibonacci retracement and found this "u-turn". Assuming Market Baseline (Yellow) will continue to show an uptrend.
Even though, this may be the last chance for the price to move down [short] as shown in snapshot image, if it becomes a reversal.
2-Hour chart signals a soon possible downward [SHORT] reversal. Contrary to posted idea [See IMAGE below]
I set a Fibonacci within a major Fibonacci retracement and found this "u-turn". Assuming Market Baseline (Yellow) will continue to show an uptrend.
Even though, this may be the last chance for the price to move down [short] as shown in snapshot image, if it becomes a reversal.
ملاحظة
Price hit 61.8% of past Fibonacci retracement tool placed, if it will continue up, it will rise to at least $1,110.تم فتح الصفقة
$1070 Buy Stop entryأغلقت الصفقة: تم الوصول للهدف
$1092 trade close
منشورات ذات صلة
إخلاء المسؤولية
لا يُقصد بالمعلومات والمنشورات أن تكون، أو تشكل، أي نصيحة مالية أو استثمارية أو تجارية أو أنواع أخرى من النصائح أو التوصيات المقدمة أو المعتمدة من TradingView. اقرأ المزيد في شروط الاستخدام.
منشورات ذات صلة
إخلاء المسؤولية
لا يُقصد بالمعلومات والمنشورات أن تكون، أو تشكل، أي نصيحة مالية أو استثمارية أو تجارية أو أنواع أخرى من النصائح أو التوصيات المقدمة أو المعتمدة من TradingView. اقرأ المزيد في شروط الاستخدام.