
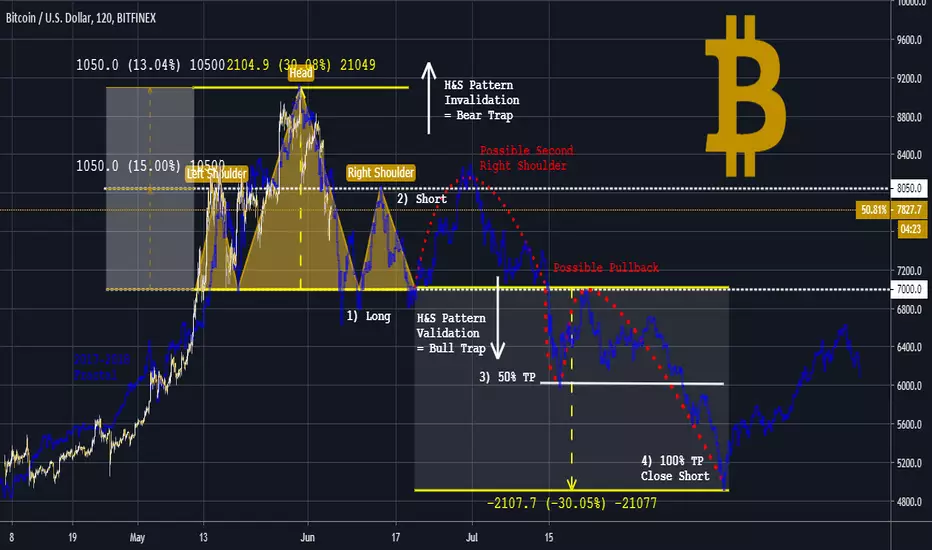
As a comment of my previous idea published this morning,
I wisely pointed out that the neck line of my H&S is more logically on the psychological $7000
So here is my modified chart, which makes my target even more bearish:
A FIRST LEVEL AT $6000 THEN A SECOND SUB-$5000...
which is much more consistent with my previous analysis elsewhere! (see Related Ideas below)
I also validated this chart with a fractal of the bursting of the 2017 bubble (in blue)
which reminds that a second right shoulder is possible in case the bulls are slow to surrender
I remind you that this is only a hypothesis, certainly very plausible
BUT which requires preliminary intermediate validations as indicated on my chart !
I wisely pointed out that the neck line of my H&S is more logically on the psychological $7000
So here is my modified chart, which makes my target even more bearish:
A FIRST LEVEL AT $6000 THEN A SECOND SUB-$5000...
which is much more consistent with my previous analysis elsewhere! (see Related Ideas below)
I also validated this chart with a fractal of the bursting of the 2017 bubble (in blue)
which reminds that a second right shoulder is possible in case the bulls are slow to surrender
I remind you that this is only a hypothesis, certainly very plausible
BUT which requires preliminary intermediate validations as indicated on my chart !

منشورات ذات صلة
إخلاء المسؤولية
لا يُقصد بالمعلومات والمنشورات أن تكون، أو تشكل، أي نصيحة مالية أو استثمارية أو تجارية أو أنواع أخرى من النصائح أو التوصيات المقدمة أو المعتمدة من TradingView. اقرأ المزيد في شروط الاستخدام.
منشورات ذات صلة
إخلاء المسؤولية
لا يُقصد بالمعلومات والمنشورات أن تكون، أو تشكل، أي نصيحة مالية أو استثمارية أو تجارية أو أنواع أخرى من النصائح أو التوصيات المقدمة أو المعتمدة من TradingView. اقرأ المزيد في شروط الاستخدام.