
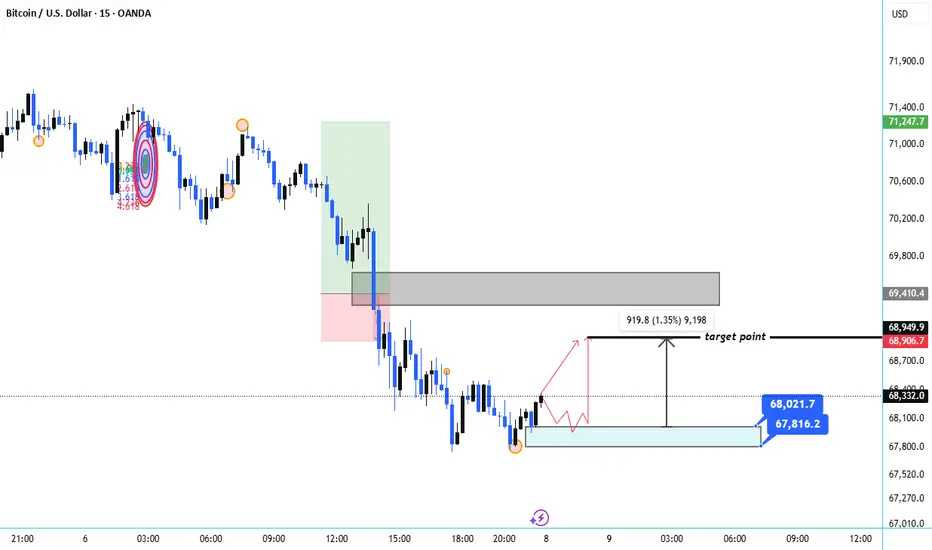
The chart shows a strong bearish structure followed by price entering a demand/support zone around 67,800 – 67,600. This area previously acted as liquidity where buyers stepped in.
🔎 Key Observations
Clear Downtrend: Market formed consistent lower highs and lower lows, confirming bearish momentum.
Supply Zone Rejection: The grey zone around 69,300 – 69,500 acted as strong resistance where sellers entered aggressively.
Liquidity Sweep: The recent wick near 67,800 suggests a sell-side liquidity grab, often followed by a short-term bounce.
Accumulation Zone: Price is consolidating inside the blue demand zone (≈67,800 – 67,600) indicating potential buyer interest.
📈 Bullish Recovery Scenario
If the support holds:
Entry Zone: 67,800 – 67,600
Target Move: Toward 68,900 – 69,000
Projected Move: About +1.35% (~900 points) upside.
This move would likely be a retracement toward the previous supply zone.
⚠️ Bearish Scenario
If price breaks and closes below 67,600, the market could continue the downtrend toward:
67,200
67,000 psychological support
🧠 Summary
Market trend: Bearish
Short-term bias: Bullish pullback from demand
Key resistance: 68,900 – 69,400
Key support: 67,600
✔ Expect a short-term bounce before potential continuation of the larger bearish trend.
🔎 Key Observations
Clear Downtrend: Market formed consistent lower highs and lower lows, confirming bearish momentum.
Supply Zone Rejection: The grey zone around 69,300 – 69,500 acted as strong resistance where sellers entered aggressively.
Liquidity Sweep: The recent wick near 67,800 suggests a sell-side liquidity grab, often followed by a short-term bounce.
Accumulation Zone: Price is consolidating inside the blue demand zone (≈67,800 – 67,600) indicating potential buyer interest.
📈 Bullish Recovery Scenario
If the support holds:
Entry Zone: 67,800 – 67,600
Target Move: Toward 68,900 – 69,000
Projected Move: About +1.35% (~900 points) upside.
This move would likely be a retracement toward the previous supply zone.
⚠️ Bearish Scenario
If price breaks and closes below 67,600, the market could continue the downtrend toward:
67,200
67,000 psychological support
🧠 Summary
Market trend: Bearish
Short-term bias: Bullish pullback from demand
Key resistance: 68,900 – 69,400
Key support: 67,600
✔ Expect a short-term bounce before potential continuation of the larger bearish trend.

JOIN MY TELEGRAM CHANNEL LINK t.me/mindgolde JOIN MY TELEGRAM CHANNEL LINK t.me/mindgolde
إخلاء المسؤولية
لا يُقصد بالمعلومات والمنشورات أن تكون، أو تشكل، أي نصيحة مالية أو استثمارية أو تجارية أو أنواع أخرى من النصائح أو التوصيات المقدمة أو المعتمدة من TradingView. اقرأ المزيد في شروط الاستخدام.
JOIN MY TELEGRAM CHANNEL LINK t.me/mindgolde JOIN MY TELEGRAM CHANNEL LINK t.me/mindgolde
إخلاء المسؤولية
لا يُقصد بالمعلومات والمنشورات أن تكون، أو تشكل، أي نصيحة مالية أو استثمارية أو تجارية أو أنواع أخرى من النصائح أو التوصيات المقدمة أو المعتمدة من TradingView. اقرأ المزيد في شروط الاستخدام.