
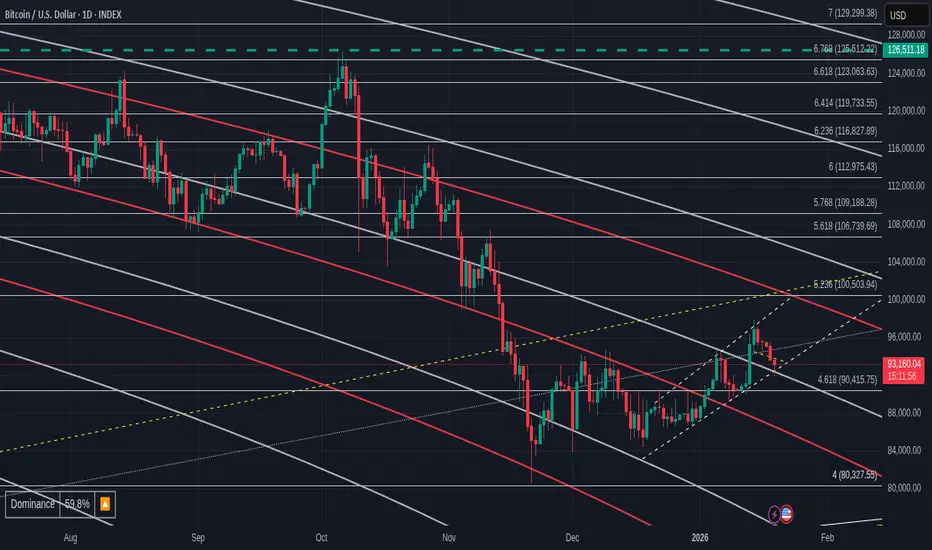
The Lines falling from Left to Right are sections of Fib Circles.
While I think we are certainly in a Bearish environment, I do see Bullish signs BUT we do have to be VERY Careful right now. The potential now, for a deeper drop is ever presant.
On the daily chart above. we can see that PA has been in a rising channel and we have now dropped back to the lower trendline, that will hopefully be Support.
We can also see how PA has come back dowm to test that Fib Circle as support.
Look back and see how that same Circle was used to push PA higher to a New ATH.
If we loose the dashed line of support, I can see PA sliding down the top side of this Fib Circle.....rather than Falling through.
That would NOT BE GOOD
But lets look at the 4 hour

Here we can see how PA has landed on the intersection of the Lower trend line of support and the Fib circle..that should be strong enough to hold.....If not, next stop 90400.
We can also see on this chart how the Longs will have been flushed out by that sudden drop. You were warned.
But there are Longs that still exist...be careful
So How much strength does Bitcoin have right now ?
Daily MACD

Remember that Line of resistance I showed you on the MACD ?
Looks like we getting rejected and until we break Over that line.....we remain Bearish
The 4 Hour MACD

MACD also falling here so certainly the potential for further Drops...but we are below Neutral here, so a turn around can happen, which would stall the Fall on Daily, Not Stop it................
Daily RSI

Falling with room to drop further.
4 Hour RSI

Getting down near support line and so this also could stall the continued Fall on the dai;y but very unlikely to Stop it longer term.
Conclusion.
PA showing it seems to want to slowdown short term and Longer term the Range / Drop will continue.
This Danger will only last as long as the Daily MACD / RSI Falls. The Weekly still shows Bullish opportunities and so it could be that PA is simply Cooling off from its recent push higher.
We may get more Sharp Dips But I am really Hoping that this Fib circle Will remain as support on a Daily chart.
Understand, that on the shorter term, we may see pushes up....but longer term, PA needs to cool off.
And the intersection of trendlines that PA hit shows a very Good Targetted move..
The BULLS are stil here.
While I think we are certainly in a Bearish environment, I do see Bullish signs BUT we do have to be VERY Careful right now. The potential now, for a deeper drop is ever presant.
On the daily chart above. we can see that PA has been in a rising channel and we have now dropped back to the lower trendline, that will hopefully be Support.
We can also see how PA has come back dowm to test that Fib Circle as support.
Look back and see how that same Circle was used to push PA higher to a New ATH.
If we loose the dashed line of support, I can see PA sliding down the top side of this Fib Circle.....rather than Falling through.
That would NOT BE GOOD
But lets look at the 4 hour
Here we can see how PA has landed on the intersection of the Lower trend line of support and the Fib circle..that should be strong enough to hold.....If not, next stop 90400.
We can also see on this chart how the Longs will have been flushed out by that sudden drop. You were warned.
But there are Longs that still exist...be careful
So How much strength does Bitcoin have right now ?
Daily MACD
Remember that Line of resistance I showed you on the MACD ?
Looks like we getting rejected and until we break Over that line.....we remain Bearish
The 4 Hour MACD
MACD also falling here so certainly the potential for further Drops...but we are below Neutral here, so a turn around can happen, which would stall the Fall on Daily, Not Stop it................
Daily RSI
Falling with room to drop further.
4 Hour RSI
Getting down near support line and so this also could stall the continued Fall on the dai;y but very unlikely to Stop it longer term.
Conclusion.
PA showing it seems to want to slowdown short term and Longer term the Range / Drop will continue.
This Danger will only last as long as the Daily MACD / RSI Falls. The Weekly still shows Bullish opportunities and so it could be that PA is simply Cooling off from its recent push higher.
We may get more Sharp Dips But I am really Hoping that this Fib circle Will remain as support on a Daily chart.
Understand, that on the shorter term, we may see pushes up....but longer term, PA needs to cool off.
And the intersection of trendlines that PA hit shows a very Good Targetted move..
The BULLS are stil here.

Nothing to be taken as Financial advice.
I will always say
"Only invest what you can afford to loose. When you are ready, take out your original investment. This way, it is only your profit that is at risk"
THAT is Financial advice
I will always say
"Only invest what you can afford to loose. When you are ready, take out your original investment. This way, it is only your profit that is at risk"
THAT is Financial advice
إخلاء المسؤولية
لا يُقصد بالمعلومات والمنشورات أن تكون، أو تشكل، أي نصيحة مالية أو استثمارية أو تجارية أو أنواع أخرى من النصائح أو التوصيات المقدمة أو المعتمدة من TradingView. اقرأ المزيد في شروط الاستخدام.
Nothing to be taken as Financial advice.
I will always say
"Only invest what you can afford to loose. When you are ready, take out your original investment. This way, it is only your profit that is at risk"
THAT is Financial advice
I will always say
"Only invest what you can afford to loose. When you are ready, take out your original investment. This way, it is only your profit that is at risk"
THAT is Financial advice
إخلاء المسؤولية
لا يُقصد بالمعلومات والمنشورات أن تكون، أو تشكل، أي نصيحة مالية أو استثمارية أو تجارية أو أنواع أخرى من النصائح أو التوصيات المقدمة أو المعتمدة من TradingView. اقرأ المزيد في شروط الاستخدام.