
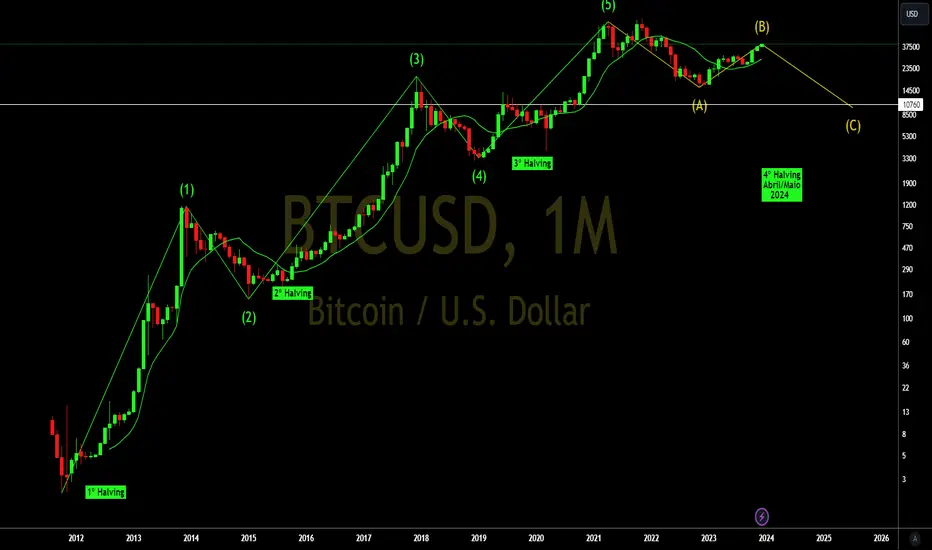
BTC on the long-term chart is in a bullish pivot. See the image below.

The red lines are the resistance points that the crypto needs to overcome to reach the yellow lines (Targets).
On the medium-term chart, prices are also in an upward pivot. See image below.

Remember if. The red lines are resistance points.
In the short term I see a rise in drift. What a thing, right?

The bulls had better start acting, and push prices hard above 44.9K.
At the moment, the limiter is the 42K region. We had an accumulation that projects highs up to the mentioned range (42K).

Below is an updated graphic image of the 12345ABC Elliott pattern! Don't get stuck in the past!

Do your analysis and good business.
Be aware, if you buy, use stop loss.
See other graphical analyzes below.
The red lines are the resistance points that the crypto needs to overcome to reach the yellow lines (Targets).
On the medium-term chart, prices are also in an upward pivot. See image below.
Remember if. The red lines are resistance points.
In the short term I see a rise in drift. What a thing, right?
The bulls had better start acting, and push prices hard above 44.9K.
At the moment, the limiter is the 42K region. We had an accumulation that projects highs up to the mentioned range (42K).
Below is an updated graphic image of the 12345ABC Elliott pattern! Don't get stuck in the past!
Do your analysis and good business.
Be aware, if you buy, use stop loss.
See other graphical analyzes below.

منشورات ذات صلة
إخلاء المسؤولية
لا يُقصد بالمعلومات والمنشورات أن تكون، أو تشكل، أي نصيحة مالية أو استثمارية أو تجارية أو أنواع أخرى من النصائح أو التوصيات المقدمة أو المعتمدة من TradingView. اقرأ المزيد في شروط الاستخدام.
منشورات ذات صلة
إخلاء المسؤولية
لا يُقصد بالمعلومات والمنشورات أن تكون، أو تشكل، أي نصيحة مالية أو استثمارية أو تجارية أو أنواع أخرى من النصائح أو التوصيات المقدمة أو المعتمدة من TradingView. اقرأ المزيد في شروط الاستخدام.