
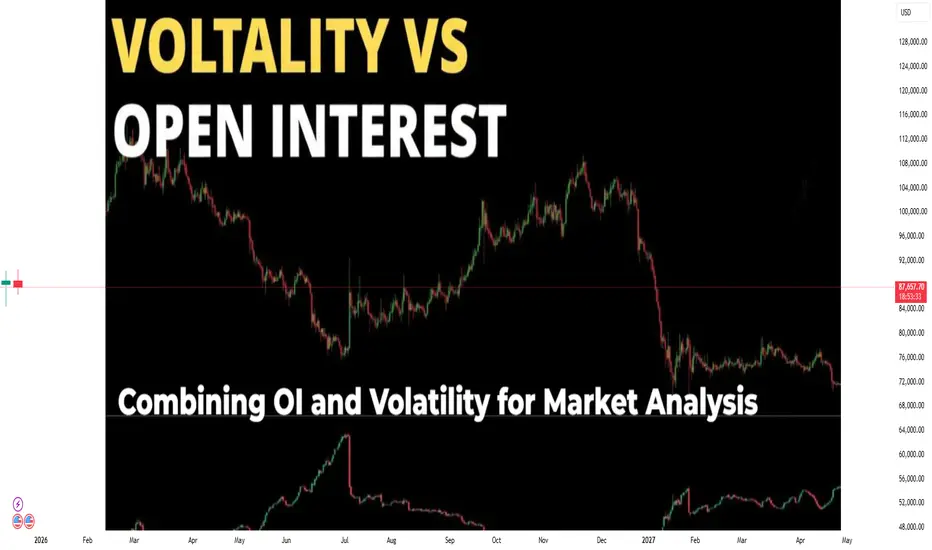
In derivatives and options markets, volatility and open interest (OI) are two of the most powerful indicators available to traders. Individually, each provides valuable insights into market behavior, sentiment, and risk. However, when combined, volatility and open interest create a far deeper and more reliable framework for understanding price action, identifying institutional activity, and anticipating future market moves. This integrated analysis is widely used by professional traders, market makers, and risk managers to decode the hidden structure of the market.
This article explains volatility and open interest in detail and then focuses on how their combined interpretation can significantly enhance market analysis and decision-making.
Understanding Volatility
Volatility measures the degree of price fluctuation in an asset over a given period. In simple terms, it reflects how fast and how far prices are moving. Higher volatility indicates larger and more frequent price swings, while lower volatility suggests stable and narrow price movements.
There are two main types of volatility used in trading:
Historical Volatility (HV)
Calculated from past price data
Shows how volatile the asset has been
Useful for understanding past behavior
Implied Volatility (IV)
Derived from option prices
Reflects market expectations of future price movement
Rises when traders expect big moves and falls when uncertainty reduces
Volatility is often called the “fear gauge” of the market because it increases sharply during uncertainty, events, or panic and contracts during calm or range-bound conditions.
Understanding Open Interest (OI)
Open interest represents the total number of outstanding derivative contracts (options or futures) that have not yet been closed or settled. Unlike trading volume, which counts how many contracts were traded in a session, OI reflects how many positions are currently active in the market.
Key characteristics of open interest:
Rising OI → New money entering the market
Falling OI → Positions being closed or unwound
High OI → Strong participation and liquidity
Low OI → Weak participation or lack of conviction
Open interest is particularly useful for understanding market commitment and institutional positioning. Big players usually build positions over time, which results in visible changes in OI.
Why Combine Volatility and Open Interest?
While volatility shows price uncertainty and expectations, open interest reveals participation and commitment. When analyzed together, they answer three critical questions:
Is the market expecting a big move?
Are traders committing capital to that expectation?
Is the move driven by fresh positions or position unwinding?
This combination helps traders avoid false signals and improves confidence in market analysis.
Key Volatility and Open Interest Combinations
1. Rising Volatility + Rising Open Interest
This is one of the strongest signals in market analysis.
Indicates increasing uncertainty or anticipation of a major move
New positions are being added aggressively
Often seen before breakouts, trend continuations, or major events
Interpretation:
Market participants are actively positioning for a large directional or volatile move. This often precedes sharp price action.
2. Rising Volatility + Falling Open Interest
This combination signals position unwinding under stress.
Volatility rises due to panic or forced exits
OI declines as traders close positions
Often seen during market crashes or sharp reversals
Interpretation:
The move is driven more by fear and liquidation than fresh conviction. Sustainability of the move may be limited.
3. Falling Volatility + Rising Open Interest
This scenario is typical during market consolidation.
Price remains in a narrow range
Volatility compresses
Traders continue to build positions quietly
Interpretation:
The market is in accumulation mode, and a volatility expansion is likely in the future. Breakouts from such phases are often powerful.
4. Falling Volatility + Falling Open Interest
This indicates market disinterest or exhaustion.
Traders are exiting positions
No strong directional expectations
Low conviction environment
Interpretation:
The market is likely to remain sideways or drift slowly until new information or catalysts emerge.
Application in Options Trading
In options markets, the interaction between implied volatility and open interest is especially critical.
High IV + High OI → Expensive options with strong expectations
Low IV + High OI → Potential volatility expansion opportunity
High IV + Falling OI → IV collapse risk (option sellers gaining control)
Option writers often focus on periods of high IV and stable OI, while option buyers look for low IV with rising OI, anticipating future volatility expansion.
Strike-Wise Open Interest and Volatility
Analyzing OI and IV at specific option strikes provides insight into support and resistance zones.
High Call OI + Rising IV → Strong resistance expectations
High Put OI + Rising IV → Strong support expectations
Sudden IV rise at a specific strike → Event risk or smart money positioning
This analysis is particularly useful for index options and short-term trading strategies.
Identifying Smart Money Activity
Institutional traders rarely enter positions impulsively. Their presence often shows up as:
Gradual rise in OI
Stable or slightly rising volatility
Price moving in a controlled manner
When volatility suddenly expands after prolonged OI buildup, it often signals institutional execution or news-driven movement.
Risk Management Benefits
Combining volatility and OI improves risk management by:
Identifying false breakouts
Avoiding trades during low participation
Adjusting position sizing during high volatility
Timing entries before volatility expansion
Traders who ignore either volatility or open interest often misjudge risk, especially in leveraged instruments like options.
Limitations and Cautions
While powerful, this approach has limitations:
Sudden news can override all indicators
OI data is end-of-day, not real-time
Volatility can be artificially inflated before events
Requires context with price action and volume
Therefore, volatility and open interest should be used alongside technical analysis, market structure, and risk controls.
Conclusion
Volatility and open interest are not just indicators; they are market behavior metrics. Volatility reflects expectations and fear, while open interest reveals conviction and capital commitment. When combined, they provide a multidimensional view of the market that goes far beyond price alone.
For traders and investors, mastering the relationship between volatility and open interest leads to better timing, stronger confirmation, and superior risk management. Whether in options, futures, or index trading, this integrated analysis helps distinguish between noise and meaningful market moves—transforming raw data into actionable insight.
This article explains volatility and open interest in detail and then focuses on how their combined interpretation can significantly enhance market analysis and decision-making.
Understanding Volatility
Volatility measures the degree of price fluctuation in an asset over a given period. In simple terms, it reflects how fast and how far prices are moving. Higher volatility indicates larger and more frequent price swings, while lower volatility suggests stable and narrow price movements.
There are two main types of volatility used in trading:
Historical Volatility (HV)
Calculated from past price data
Shows how volatile the asset has been
Useful for understanding past behavior
Implied Volatility (IV)
Derived from option prices
Reflects market expectations of future price movement
Rises when traders expect big moves and falls when uncertainty reduces
Volatility is often called the “fear gauge” of the market because it increases sharply during uncertainty, events, or panic and contracts during calm or range-bound conditions.
Understanding Open Interest (OI)
Open interest represents the total number of outstanding derivative contracts (options or futures) that have not yet been closed or settled. Unlike trading volume, which counts how many contracts were traded in a session, OI reflects how many positions are currently active in the market.
Key characteristics of open interest:
Rising OI → New money entering the market
Falling OI → Positions being closed or unwound
High OI → Strong participation and liquidity
Low OI → Weak participation or lack of conviction
Open interest is particularly useful for understanding market commitment and institutional positioning. Big players usually build positions over time, which results in visible changes in OI.
Why Combine Volatility and Open Interest?
While volatility shows price uncertainty and expectations, open interest reveals participation and commitment. When analyzed together, they answer three critical questions:
Is the market expecting a big move?
Are traders committing capital to that expectation?
Is the move driven by fresh positions or position unwinding?
This combination helps traders avoid false signals and improves confidence in market analysis.
Key Volatility and Open Interest Combinations
1. Rising Volatility + Rising Open Interest
This is one of the strongest signals in market analysis.
Indicates increasing uncertainty or anticipation of a major move
New positions are being added aggressively
Often seen before breakouts, trend continuations, or major events
Interpretation:
Market participants are actively positioning for a large directional or volatile move. This often precedes sharp price action.
2. Rising Volatility + Falling Open Interest
This combination signals position unwinding under stress.
Volatility rises due to panic or forced exits
OI declines as traders close positions
Often seen during market crashes or sharp reversals
Interpretation:
The move is driven more by fear and liquidation than fresh conviction. Sustainability of the move may be limited.
3. Falling Volatility + Rising Open Interest
This scenario is typical during market consolidation.
Price remains in a narrow range
Volatility compresses
Traders continue to build positions quietly
Interpretation:
The market is in accumulation mode, and a volatility expansion is likely in the future. Breakouts from such phases are often powerful.
4. Falling Volatility + Falling Open Interest
This indicates market disinterest or exhaustion.
Traders are exiting positions
No strong directional expectations
Low conviction environment
Interpretation:
The market is likely to remain sideways or drift slowly until new information or catalysts emerge.
Application in Options Trading
In options markets, the interaction between implied volatility and open interest is especially critical.
High IV + High OI → Expensive options with strong expectations
Low IV + High OI → Potential volatility expansion opportunity
High IV + Falling OI → IV collapse risk (option sellers gaining control)
Option writers often focus on periods of high IV and stable OI, while option buyers look for low IV with rising OI, anticipating future volatility expansion.
Strike-Wise Open Interest and Volatility
Analyzing OI and IV at specific option strikes provides insight into support and resistance zones.
High Call OI + Rising IV → Strong resistance expectations
High Put OI + Rising IV → Strong support expectations
Sudden IV rise at a specific strike → Event risk or smart money positioning
This analysis is particularly useful for index options and short-term trading strategies.
Identifying Smart Money Activity
Institutional traders rarely enter positions impulsively. Their presence often shows up as:
Gradual rise in OI
Stable or slightly rising volatility
Price moving in a controlled manner
When volatility suddenly expands after prolonged OI buildup, it often signals institutional execution or news-driven movement.
Risk Management Benefits
Combining volatility and OI improves risk management by:
Identifying false breakouts
Avoiding trades during low participation
Adjusting position sizing during high volatility
Timing entries before volatility expansion
Traders who ignore either volatility or open interest often misjudge risk, especially in leveraged instruments like options.
Limitations and Cautions
While powerful, this approach has limitations:
Sudden news can override all indicators
OI data is end-of-day, not real-time
Volatility can be artificially inflated before events
Requires context with price action and volume
Therefore, volatility and open interest should be used alongside technical analysis, market structure, and risk controls.
Conclusion
Volatility and open interest are not just indicators; they are market behavior metrics. Volatility reflects expectations and fear, while open interest reveals conviction and capital commitment. When combined, they provide a multidimensional view of the market that goes far beyond price alone.
For traders and investors, mastering the relationship between volatility and open interest leads to better timing, stronger confirmation, and superior risk management. Whether in options, futures, or index trading, this integrated analysis helps distinguish between noise and meaningful market moves—transforming raw data into actionable insight.

منشورات ذات صلة
إخلاء المسؤولية
لا يُقصد بالمعلومات والمنشورات أن تكون، أو تشكل، أي نصيحة مالية أو استثمارية أو تجارية أو أنواع أخرى من النصائح أو التوصيات المقدمة أو المعتمدة من TradingView. اقرأ المزيد في شروط الاستخدام.
منشورات ذات صلة
إخلاء المسؤولية
لا يُقصد بالمعلومات والمنشورات أن تكون، أو تشكل، أي نصيحة مالية أو استثمارية أو تجارية أو أنواع أخرى من النصائح أو التوصيات المقدمة أو المعتمدة من TradingView. اقرأ المزيد في شروط الاستخدام.