
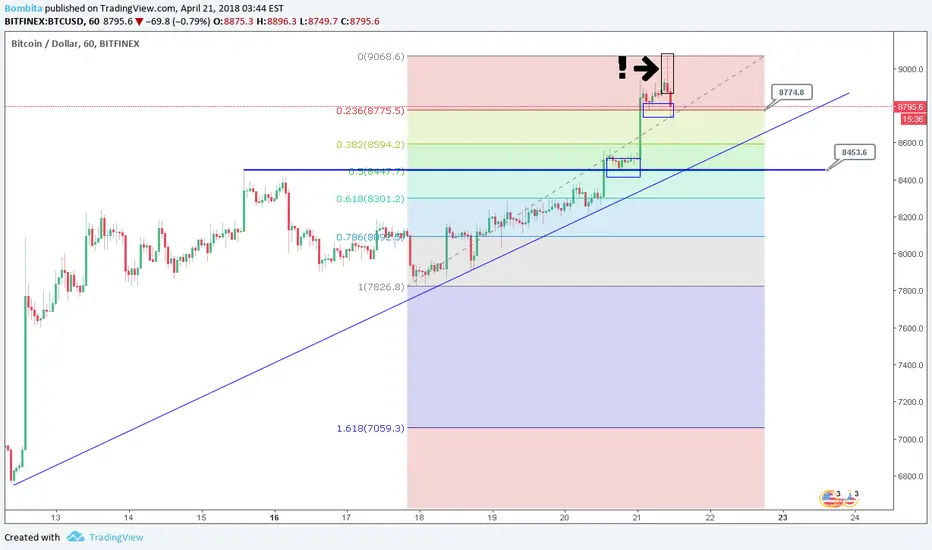
The falling star
On the hour chart we can see the falling star pattern ( in the black rectangle ) It's the bearish reversal pattern , be careful.
I marked the support zones and trend line.
Let's see what happens next.
The MACD divergence

The RSI overbought

On the hour chart we can see the falling star pattern ( in the black rectangle ) It's the bearish reversal pattern , be careful.
I marked the support zones and trend line.
Let's see what happens next.
The MACD divergence
The RSI overbought
ملاحظة
On the hour chart we can se the peculiar pennant.ENTRY The closure of the four hour candle above the level of 9070 or 8999 ( less safe )
ملاحظة
ImportantlyThe closure of the four hour candle above the level of 9070 will mean cancellation the falling star pattern.
It's will be the strong bullish sign
ملاحظة
ImportantlyThe closure of the four hour candle above the level of 9070 will mean the cancellation of the falling star pattern
It's will be the strong bullish sign
ملاحظة
The price tests the resistance levelملاحظة
The another falling star , be careful ملاحظة
I have adjusted the trading range.STOP-LIMIT 9341 ( In case of a sharp rise )
ENTRY The closure of the four hour candle above the level of 9070
ملاحظة
The MACD shows the change of trend , it's the weak signal , but be careful ملاحظة
The price confirmed the trend line againThe resistance zones

إخلاء المسؤولية
لا يُقصد بالمعلومات والمنشورات أن تكون، أو تشكل، أي نصيحة مالية أو استثمارية أو تجارية أو أنواع أخرى من النصائح أو التوصيات المقدمة أو المعتمدة من TradingView. اقرأ المزيد في شروط الاستخدام.
إخلاء المسؤولية
لا يُقصد بالمعلومات والمنشورات أن تكون، أو تشكل، أي نصيحة مالية أو استثمارية أو تجارية أو أنواع أخرى من النصائح أو التوصيات المقدمة أو المعتمدة من TradingView. اقرأ المزيد في شروط الاستخدام.