
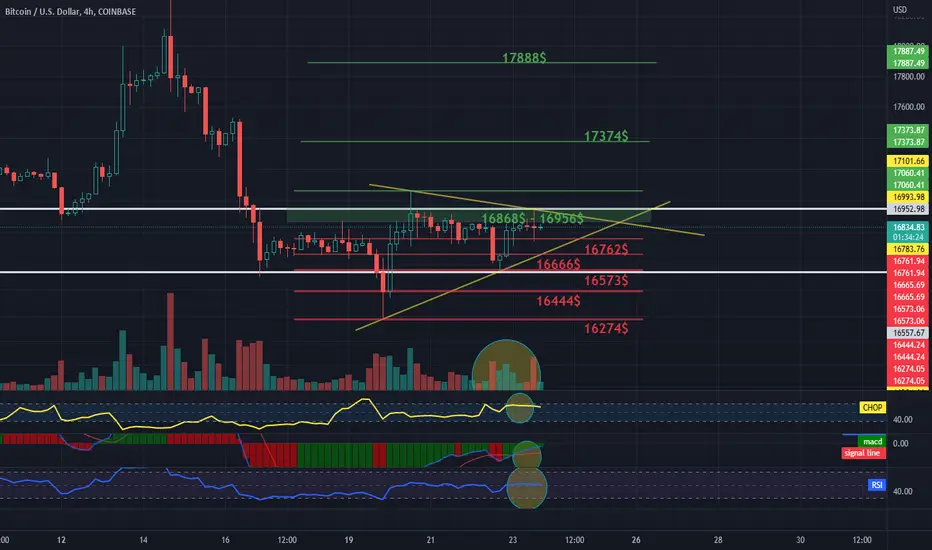
BTC chart in pair to USDT on a four-hour interval.
As we can see, BTC has been moving in the sideways trend channel for a long time, moreover, we can mark the triangle with the help of white lines, which we are currently trying to lower down.
Now, with the help of Fib Retracement, we will check the support places for BTC in case the price starts to fall and here we can see that we have the first support at the price of $ 16,762, the second at the price of $ 16,666, but stronger supports are at the levels of $ 16,573, $ 16,444 and $ 16,274 which is the location of the last price low.
Going further, in the same way, we will determine what resistance the price should encounter on the way to increases. As we can see in the first place we have a strong zone with which the price is currently measuring from $16868 to $16956, only when it breaks out and positively tests the resistance it will start moving towards the second resistance at $17060, then $17374 and $17888.
Please pay attention to the volume because you can see that it is not high, but with a predominance of candles on the buyers' side. Next we have the CHOP index, where we see that a lot of energy has been collected, which may indicate an upcoming strong move, while the MACD confirms the uptrend. Let's also pay attention to the RSI on which we can see that the corrections are getting weaker and that there is room for an upward move.
As we can see, BTC has been moving in the sideways trend channel for a long time, moreover, we can mark the triangle with the help of white lines, which we are currently trying to lower down.
Now, with the help of Fib Retracement, we will check the support places for BTC in case the price starts to fall and here we can see that we have the first support at the price of $ 16,762, the second at the price of $ 16,666, but stronger supports are at the levels of $ 16,573, $ 16,444 and $ 16,274 which is the location of the last price low.
Going further, in the same way, we will determine what resistance the price should encounter on the way to increases. As we can see in the first place we have a strong zone with which the price is currently measuring from $16868 to $16956, only when it breaks out and positively tests the resistance it will start moving towards the second resistance at $17060, then $17374 and $17888.
Please pay attention to the volume because you can see that it is not high, but with a predominance of candles on the buyers' side. Next we have the CHOP index, where we see that a lot of energy has been collected, which may indicate an upcoming strong move, while the MACD confirms the uptrend. Let's also pay attention to the RSI on which we can see that the corrections are getting weaker and that there is room for an upward move.

إخلاء المسؤولية
لا يُقصد بالمعلومات والمنشورات أن تكون، أو تشكل، أي نصيحة مالية أو استثمارية أو تجارية أو أنواع أخرى من النصائح أو التوصيات المقدمة أو المعتمدة من TradingView. اقرأ المزيد في شروط الاستخدام.
إخلاء المسؤولية
لا يُقصد بالمعلومات والمنشورات أن تكون، أو تشكل، أي نصيحة مالية أو استثمارية أو تجارية أو أنواع أخرى من النصائح أو التوصيات المقدمة أو المعتمدة من TradingView. اقرأ المزيد في شروط الاستخدام.