
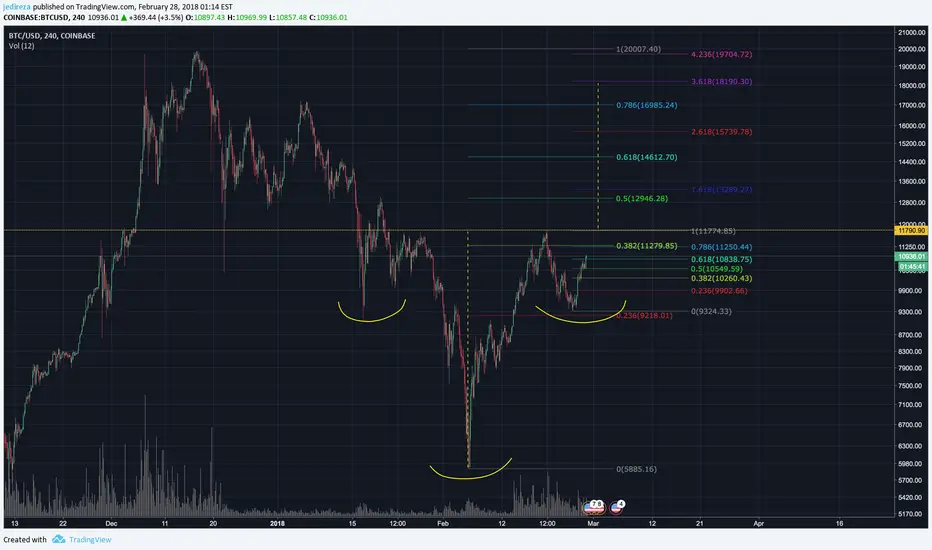
An inverse head and shoulder pattern is almost complete. If followed through, we could be looking at a target of around $18k. The volume profile is messy, though each major movement does have a decreasing volume trend.
Also shown are two fib retracements. One from all time high in mid December through the big dipper ending in the beginning of February. The second is a retracement is of the the right shoulder's high to low, and we can see price stepping up those levels.
It could also just go the other way ¯\_( $ )_/¯.
Also shown are two fib retracements. One from all time high in mid December through the big dipper ending in the beginning of February. The second is a retracement is of the the right shoulder's high to low, and we can see price stepping up those levels.
It could also just go the other way ¯\_( $ )_/¯.

إخلاء المسؤولية
لا يُقصد بالمعلومات والمنشورات أن تكون، أو تشكل، أي نصيحة مالية أو استثمارية أو تجارية أو أنواع أخرى من النصائح أو التوصيات المقدمة أو المعتمدة من TradingView. اقرأ المزيد في شروط الاستخدام.
إخلاء المسؤولية
لا يُقصد بالمعلومات والمنشورات أن تكون، أو تشكل، أي نصيحة مالية أو استثمارية أو تجارية أو أنواع أخرى من النصائح أو التوصيات المقدمة أو المعتمدة من TradingView. اقرأ المزيد في شروط الاستخدام.