
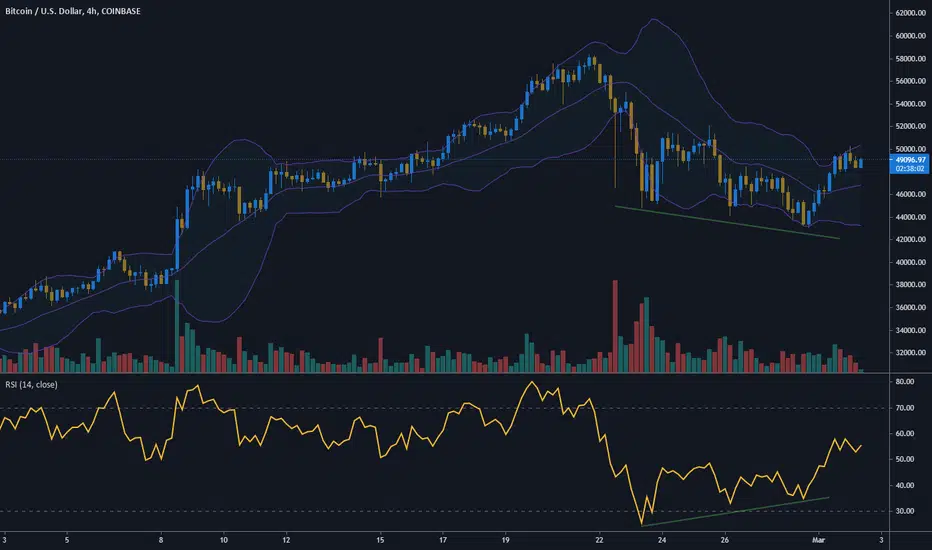
On the 4 hours chart, there is a divergence between the price and the RSI.
The price is doing lower lows but the RSI is doing higher lows.
In every new low, the price penetrates less and less the lower bollinger band.
Bullish.
The price is doing lower lows but the RSI is doing higher lows.
In every new low, the price penetrates less and less the lower bollinger band.
Bullish.

إخلاء المسؤولية
لا يُقصد بالمعلومات والمنشورات أن تكون، أو تشكل، أي نصيحة مالية أو استثمارية أو تجارية أو أنواع أخرى من النصائح أو التوصيات المقدمة أو المعتمدة من TradingView. اقرأ المزيد في شروط الاستخدام.
إخلاء المسؤولية
لا يُقصد بالمعلومات والمنشورات أن تكون، أو تشكل، أي نصيحة مالية أو استثمارية أو تجارية أو أنواع أخرى من النصائح أو التوصيات المقدمة أو المعتمدة من TradingView. اقرأ المزيد في شروط الاستخدام.