
HOW-TO: Read Markets with Confluence Using MarketMastery Suite
المزيد من المؤشرات الحصرية من dgtrd
اشترك في dgtrd • MarketMastery Tools مقابل $29.99/شهريًا للحصول على مؤشرات حصرية من هذا المؤلف. يمكنك الدفع مباشرةً على TradingView واستخدامها فورًا على الرسوم البيانية الخاصة بك.
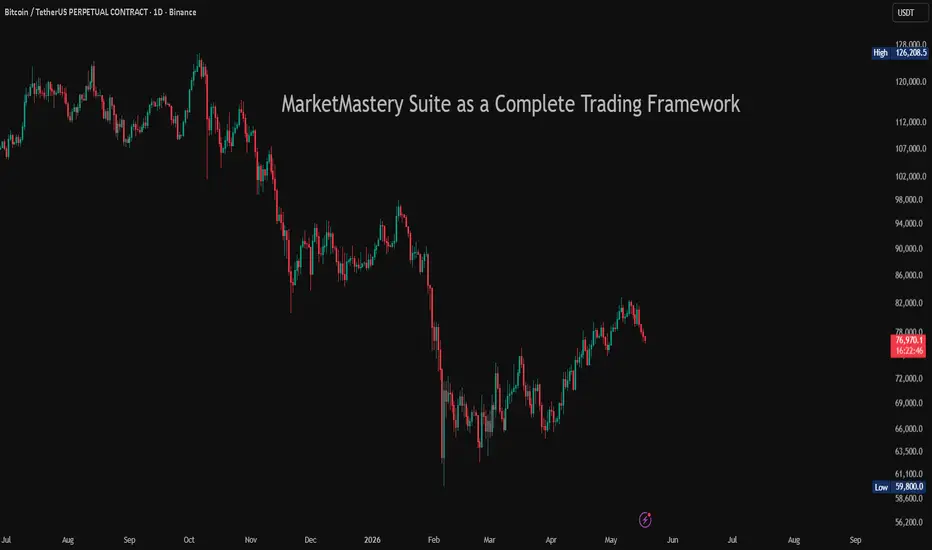
استكشف dgtrd • MarketMastery ToolsMarketMastery Suite is not a collection of indicators - it is a structured trading framework built around a single principle: no signal means anything in isolation.
Most indicators answer one question in one dimension. Price direction. Volume activity. A support level. Taken alone, each of these is incomplete - and often misleading. MarketMastery Suite is designed to answer all of them simultaneously, and more importantly, to show you when they agree.
The Suite combines six analytical modules - market structure, trailing stop, support & resistance zones, volume & capital flow, trend dashboard, and leverage risk - each built to complement the others. A support zone is more meaningful when structure confirms it. A trend signal carries more weight when volume flow agrees. A breakout is more reliable when the dashboard shows genuine capital commitment behind it.
This is confluence-based market interpretation - not feature stacking.

The modules are documented individually below. But the real edge comes from reading them together.
---
MODULE 1 - Dynamic Support & Resistance Zones
⯌ Structural Scale Options
⯌ Structural Depth
⯌ Proximity Guide Line
⯌ Zone Behaviour
⯌ Alerts
---
MODULE 2 - Trailing Stop & Range Detector
⯌ Bias States
⯌ Volume Context on Bias Change
⯌ Settings
⯌ Alerts
---
MODULE 3 - Fractal Market Structures
⯌ Structure Levels
⯌ BoS vs CHoCH
⯌ Break/Sweep Validation
⯌ ATR Multiplier
⯌ Market Structure Dashboard
⯌ Fractal Swing Labels
⯌ Alerts
---
MODULE 4 - Volume & Capital Flow
⯌ Volume Source
⯌ Volume Activity Meter
⯌ Cumulative Volume Delta (CVD)
⯌ Open Interest (Perpetual Contracts)
⯌ Visible Length
⯌ Alerts
---
MODULE 5 - Trend Snapshot Dashboard
⯌ Trend Section
⯌ Combined Interpretation
⯌ Flow Section
⯌ Volume Delta Divergence Labels
⯌ Premium Index
⯌ Evaluation Anchor Period
⯌ Evaluation Window
---
MODULE 6 - Leverage Risk Zones
⯌ Settings
⯌ What Is Displayed
⯌ Colour Logic
---
READING THE SUITE AS A FRAMEWORK
---
ALERTS SUMMARY
---
TIPS FOR USE
Most indicators answer one question in one dimension. Price direction. Volume activity. A support level. Taken alone, each of these is incomplete - and often misleading. MarketMastery Suite is designed to answer all of them simultaneously, and more importantly, to show you when they agree.
The Suite combines six analytical modules - market structure, trailing stop, support & resistance zones, volume & capital flow, trend dashboard, and leverage risk - each built to complement the others. A support zone is more meaningful when structure confirms it. A trend signal carries more weight when volume flow agrees. A breakout is more reliable when the dashboard shows genuine capital commitment behind it.
This is confluence-based market interpretation - not feature stacking.
The modules are documented individually below. But the real edge comes from reading them together.
---
MODULE 1 - Dynamic Support & Resistance Zones
Detects support and resistance zones across multiple structural scales - Micro, Minor, Major, and Macro - derived from Order Blocks and Breaker Blocks identified purely from price action. No fixed lookback or length is required; zones adapt dynamically to real market behaviour.
⯌ Structural Scale Options
Controls which swing levels are used to build the zones. Each scale is constructed from the one below it, creating a natural hierarchy of market structure - from fast-reacting short-term zones to dominant long-term structural boundaries.
- Micro Structures - The most recent short-term swings. Fastest to form and most sensitive to near-term price action.
- All Micro Structures - Shows the full recent set of Micro swings rather than just the most relevant one.
- Minor Structures - Broader swings built from Micro activity. Suitable for intraday to short-term swing context.
- Major Structures - Highlights significant turning zones for swing and position traders.
- Macro Structures - Dominant market phases relevant for long-term structural bias.
- Micro & Minor - Combines Micro swings with Minor context for a fast yet grounded view.
- Minor & Major - A balanced mid-to-long-term view. Recommended starting point for most traders.
- Multi-Scale (All) - Displays Micro through Major simultaneously for full structural visibility.
⯌ Structural Depth
Controls the sensitivity of swing detection. Default mode operates at standard depth. Incremented mode shifts the entire analysis one level higher, highlighting broader structural swings on the same chart without changing the timeframe.
⯌ Proximity Guide Line
Plots an early warning reference line above a support zone or below a resistance zone - alerting you before price actually reaches the zone. Sensitivity is adjustable independently for each structural scale via dedicated multipliers.
⯌ Zone Behaviour
Bullish zones (support) display in the bullish colour; bearish zones (resistance) in the bearish colour. When a zone is broken, it flips direction automatically - a broken support becomes resistance and is redrawn accordingly. If the flipped zone is subsequently reclaimed, it is removed from tracking entirely.
⯌ Alerts
Alerts fire on: zone breaks, rejections at zone boundaries, retests after a break, proximity line reactions, and proximity zone entries. Each alert includes the relevant price level and ticker context.
---
MODULE 2 - Trailing Stop & Range Detector
A multi-layered trailing stop that communicates directional bias, transition momentum, and ranging conditions through its visual fill - rather than a single line. The fill colour and intensity change with each bias state, making conviction immediately visible.
⯌ Bias States
- Bullish Bias - All layers have confirmed an upward flip. Strong directional confirmation.
- Bearish Bias - All layers have confirmed a downward flip. Strong directional confirmation.
- Potential Bullish Shift - Bias is developing upward but not yet fully confirmed.
- Potential Bearish Shift - Bias is developing downward but not yet fully confirmed.
- Ranging / Transitioning - No clear directional strength. Market may be consolidating or shifting.
⯌ Volume Context on Bias Change
When a bias transition occurs, a label is plotted at the trailing stop level showing the volume context of the flip - Low, Moderate, High, Very High, or Volume Spike. This helps distinguish high-conviction transitions from low-participation noise.
⯌ Settings
Length controls the lookback period for the trailing stop calculation. Factor adjusts the sensitivity of the stop to price movement. Colours for Bullish, Bearish, and Ranging states are independently configurable.
⯌ Alerts
Fires on every bias transition - Bullish, Bearish, Potential Flip, or Ranging - with volume context included in the alert message.
---
MODULE 3 - Fractal Market Structures
Detects Break of Structure (BoS) and Change of Character (CHoCH) events across four fractal levels - Micro, Minor, Major, and Macro. Swing points are identified using pure price action without fixed lookback windows, allowing structures to adapt naturally to real market behaviour.
⯌ Structure Levels
- Micro - Fast-moving structures from recent price fluctuations. Most responsive to short-term shifts.
- Minor - Broader structures derived from Micro activity. Offers more reliable trend context.
- Major - Identifies significant market turning zones and high-confluence structural shifts.
- Macro - The highest-level structures, reflecting dominant market phases across large timeframes.
⯌ BoS vs CHoCH
Break of Structure (BoS) signals potential trend continuation - price has broken a prior swing in the direction of the existing trend. Change of Character (CHoCH) signals a potential reversal - price has broken against the existing trend direction, suggesting the trend may be shifting.
⯌ Break/Sweep Validation
Each structural level has an optional validation mode. When set to Validate, a break that fails to hold is flagged as a Liquidity Sweep rather than a genuine structure break - indicating smart money may have grabbed liquidity before reversing. When set to Bypass, all breaks are accepted at face value.
⯌ ATR Multiplier
Sets the dynamic buffer used to evaluate whether a structure break is sustained or a failed sweep. Each structural level has its own independently adjustable multiplier, calibrated by default to match the typical noise level at that structural scale.
⯌ Market Structure Dashboard
An optional table displaying a chronological log of recent BoS, CHoCH, and Sweep events - including event type, structural level, price at detection, and timestamp. Mobile-Friendly View removes the date/time column for better readability on smaller screens. Max Events to Show controls the list length.
⯌ Fractal Swing Labels
When a fractal display option is enabled, swing points are labelled directly on the chart with symbols sized to their structural scale. Each label's tooltip shows whether the swing is a Higher High, Higher Low, Lower High, or Lower Low, along with the exact price.
⯌ Alerts
Fires on every BoS and CHoCH detection across all enabled structural levels. Liquidity Sweep events trigger a separate alert with context about the failed break.
---
MODULE 4 - Volume & Capital Flow
Three complementary tools for reading participation and capital commitment: Volume Activity Meter, Cumulative Volume Delta, and Open Interest. Each addresses a different dimension of market activity and can be used independently or together.
⯌ Volume Source
Selected Instrument Only uses volume from the current chart symbol. Combined Spot + Perpetual merges spot and perpetual contract volumes for a more complete picture of total market participation. Combined mode is supported for crypto USD/USDT/USDC pairs where both spot and perpetual data are available.
⯌ Volume Activity Meter
Colours each bar based on volume activity relative to its baseline, accounting for time elapsed within the current bar for real-time accuracy. High-activity bullish bars appear in deep green; high-activity bearish bars in deep red. Low-activity bars are highlighted in softer tones to flag weak participation. Extreme volume events are marked directly on the chart.
⯌ Cumulative Volume Delta (CVD)
Tracks the net difference between buying-initiated and selling-initiated volume over time, overlaid on the price chart. Rising CVD alongside rising price confirms bullish participation. Divergence - CVD falling while price rises, or vice versa - may signal weakening conviction and a potential reversal.
⯌ Open Interest (Perpetual Contracts)
Displays the total number of active perpetual contract positions, overlaid on price. Rising OI alongside rising price signals new long positions - bullish conviction. Rising OI alongside falling price signals new shorts - bearish pressure. Falling OI in either direction indicates position closure and potentially weakening momentum.
⯌ Visible Length
Controls how many recent bars are used when plotting CVD and OI over the price chart, allowing you to focus on recent capital flow without affecting the underlying calculations.
⯌ Alerts
Fires when extreme volume activity is detected, with ticker and timeframe context included in the message.
---
MODULE 5 - Trend Snapshot Dashboard
A summary table providing a structured read on trend direction and strength across Price, Open Interest, and Cumulative Volume Delta, alongside real-time capital flow metrics for the current bar. All trend evaluations are anchored dynamically to a structural swing period rather than a fixed length.
⯌ Trend Section
Shows trend direction and strength for Price, Open Interest (when available), and CVD - each evaluated independently over the anchor period. Strength is categorised as Strong, Moderate, Weak, or Noisy. Direction is Uptrend, Downtrend, or Sideways. In mobile view, directional arrows replace the full text descriptions.
⯌ Combined Interpretation
Synthesises the Price, OI, and CVD trend reads into a single market assessment - such as Strong Longs, Short Squeeze, Bullish Divergence, Fragile Rally, or Bearish Reversal. Each state includes a tooltip with a detailed explanation of what the combination of signals implies.
⯌ Flow Section
Shows real-time activity for the current bar across Volume, Volume Delta, and OI Delta - each compared against its baseline and categorised as Spike, Very High, High, Moderate, or Low. Colour intensity reflects relative activity strength.
⯌ Volume Delta Divergence Labels
The Volume Delta cell signals agreement or disagreement between price direction and delta - buyers absorbing a falling bar (▲), sellers absorbing a rising bar (▼), strong aligned pressure (▲▲ or ▼▼), or market indecision (◆).
⯌ Premium Index
For crypto perpetual markets, shows the difference between perpetual and spot pricing. Positive values indicate long positioning pressure; negative values indicate short positioning pressure. Displayed as Long Bias, Short Bias, or Balanced.
⯌ Evaluation Anchor Period
Controls the lookback used for all trend calculations. Options are Minor, Major, and Macro - each corresponding to the most recent detected swing of that structural level. If the selected level has not yet formed, the next available level down is used automatically.
⯌ Evaluation Window
When enabled, highlights the active evaluation range directly on the chart as a regression channel with statistical deviation bands - making the anchor period and trend calculation range visually explicit.
---
MODULE 6 - Leverage Risk Zones
Calculates and displays estimated liquidation levels for both long and short positions based on the selected leverage, entry price, and maintenance margin rate. Assumes isolated margin with full allocation. Estimates exclude fees, funding, and interest.
⯌ Settings
- Entry Price - The reference price for liquidation calculations. When set to 0, the current close price is used automatically.
- Leverage - The leverage multiplier. Higher leverage moves liquidation levels closer to entry.
- Maintenance Margin Rate (%) - The exchange's maintenance margin rate for the relevant trading pair and position size. Default reflects a typical value for general estimation. For accuracy, refer to your exchange's margin tier table and use the rate corresponding to your actual position size.
⯌ What Is Displayed
Long and short liquidation levels are drawn to the right of the current bar with labels showing the exact price, leverage, and distance from current price. When an entry price is specified, margin call warning levels are also displayed, along with an entry label showing current ROI at the selected leverage.
⯌ Colour Logic
When no entry price is set, all levels display in neutral blue. When an entry price is defined, levels colour according to which side is currently in profit - the profitable side in teal, the at-risk side in red.
---
READING THE SUITE AS A FRAMEWORK
Each module answers a different question. The framework answers them together.
Structure (Modules 1 & 3) tells you where the market is - the zones that matter and how price has been behaving around them.
Bias (Module 2) tells you which direction has conviction - confirmed, developing, or absent.
Flow (Module 4) tells you who is behind the move - whether participation and capital are genuinely aligned with the direction.
Dashboard (Module 5) tells you how strong the confluence is - by synthesising trend, flow, and positioning across Price, OI, and CVD into a single, readable read.
Risk (Module 6) tells you where the crowd is exposed - and therefore where price is likely to be pulled.
A setup with structure, bias, and flow all aligned is fundamentally different from one with only one signal firing. The Suite makes that difference visible.
---
ALERTS SUMMARY
All alerts use the "Any alert() function call" type when creating alerts in TradingView. Each module has its own alert toggle in the settings. Active alerts include: S/R zone breaks, rejections, retests, and proximity reactions · Trailing stop bias transitions with volume context · Market structure BoS, CHoCH, and Liquidity Sweep events · Extreme volume activity.
---
TIPS FOR USE
- Start with Minor & Major S/R - The default Minor & Major zone setting gives the most balanced structural view for most trading styles.
- Use the Evaluation Window - Enabling the regression channel makes the dashboard's anchor period visually explicit, so you always know what range the trend scores are measuring.
- Validate major structures - Keep Break/Sweep Validation set to Validate for Major and Macro levels. Micro and Minor can run on Bypass for more responsive signals.
- Combined volume for crypto - If trading perpetual contracts, switching Volume Source to Combined Spot + Perpetual gives a more complete read on real participation.
- Leverage Risk Zones for confluence - Even without an active leveraged position, entering a hypothetical entry and leverage reveals where crowded liquidation clusters sit on the chart - levels that often attract price.
- Mobile view - Enable Mobile-Friendly View in both the Fractal Dashboard and Trend Snapshot settings when viewing on smaller screens.

SoleMare Analytics | MarketMastery™ Tools | Exclusively on TradingView
إخلاء المسؤولية
لا يُقصد بالمعلومات والمنشورات أن تكون، أو تشكل، أي نصيحة مالية أو استثمارية أو تجارية أو أنواع أخرى من النصائح أو التوصيات المقدمة أو المعتمدة من TradingView. اقرأ المزيد في شروط الاستخدام.
إخلاء المسؤولية
لا يُقصد بالمعلومات والمنشورات أن تكون، أو تشكل، أي نصيحة مالية أو استثمارية أو تجارية أو أنواع أخرى من النصائح أو التوصيات المقدمة أو المعتمدة من TradingView. اقرأ المزيد في شروط الاستخدام.