
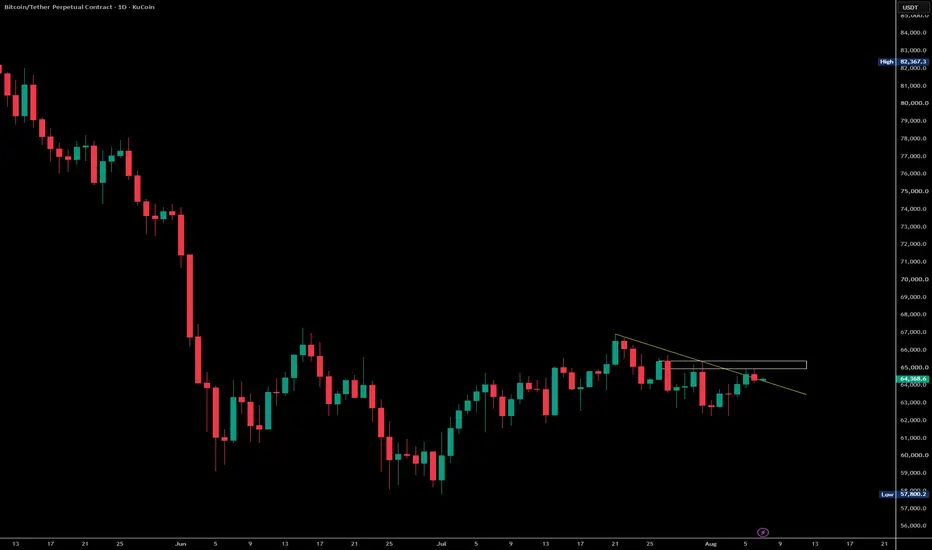
The chart shows Bitcoin consolidating below a descending trendline while testing a horizontal resistance zone around $65,000. Price has been making higher lows after the June bottom, but buyers still need to reclaim the resistance area to confirm bullish continuation.
Current Structure
📈 Recovery from the June lows remains intact.
📉 BTC is still trading below short-term descending resistance.
⚖️ Price is compressing beneath $65,000, suggesting a breakout or rejection is approaching.
Key Levels
🟢 Support
$63,000–63,500 (immediate support)
$60,000 (major support)
$57,800 (key swing low)
🔴 Resistance
$65,000–65,500 (horizontal resistance)
Descending trendline
$68,000–70,000 (next major resistance)
Bullish Scenario
A daily close above $65,500 and the descending trendline would confirm a bullish breakout.
Upside Targets
🎯 Target 1: $68,000
🎯 Target 2: $72,000
🎯 Target 3: $78,000–80,000
Bearish Scenario
If BTC is rejected from resistance and loses nearby support:
Downside Levels
📉 $63,000
📉 $60,000
📉 $57,800 (major support)
A breakdown below $57,800 would invalidate the current recovery and strengthen the bearish outlook.
Market Outlook
Bitcoin is neutral with a bullish bias as it continues to build higher lows beneath resistance. The $65,000–65,500 area is the key level to watch. A confirmed breakout could trigger the next impulsive move higher, while rejection would likely keep BTC range-bound or lead to another pullback.
Current Structure
📈 Recovery from the June lows remains intact.
📉 BTC is still trading below short-term descending resistance.
⚖️ Price is compressing beneath $65,000, suggesting a breakout or rejection is approaching.
Key Levels
🟢 Support
$63,000–63,500 (immediate support)
$60,000 (major support)
$57,800 (key swing low)
🔴 Resistance
$65,000–65,500 (horizontal resistance)
Descending trendline
$68,000–70,000 (next major resistance)
Bullish Scenario
A daily close above $65,500 and the descending trendline would confirm a bullish breakout.
Upside Targets
🎯 Target 1: $68,000
🎯 Target 2: $72,000
🎯 Target 3: $78,000–80,000
Bearish Scenario
If BTC is rejected from resistance and loses nearby support:
Downside Levels
📉 $63,000
📉 $60,000
📉 $57,800 (major support)
A breakdown below $57,800 would invalidate the current recovery and strengthen the bearish outlook.
Market Outlook
Bitcoin is neutral with a bullish bias as it continues to build higher lows beneath resistance. The $65,000–65,500 area is the key level to watch. A confirmed breakout could trigger the next impulsive move higher, while rejection would likely keep BTC range-bound or lead to another pullback.

Twitter: x.com/crypto_vulture1
📊 TA & strategies
Telegram: t.me/crypto_vulture_signals
📊 TA & strategies
Telegram: t.me/crypto_vulture_signals
إخلاء المسؤولية
لا يُقصد بالمعلومات والمنشورات أن تكون، أو تشكل، أي نصيحة مالية أو استثمارية أو تجارية أو أنواع أخرى من النصائح أو التوصيات المقدمة أو المعتمدة من TradingView. اقرأ المزيد في شروط الاستخدام.
Twitter: x.com/crypto_vulture1
📊 TA & strategies
Telegram: t.me/crypto_vulture_signals
📊 TA & strategies
Telegram: t.me/crypto_vulture_signals
إخلاء المسؤولية
لا يُقصد بالمعلومات والمنشورات أن تكون، أو تشكل، أي نصيحة مالية أو استثمارية أو تجارية أو أنواع أخرى من النصائح أو التوصيات المقدمة أو المعتمدة من TradingView. اقرأ المزيد في شروط الاستخدام.