
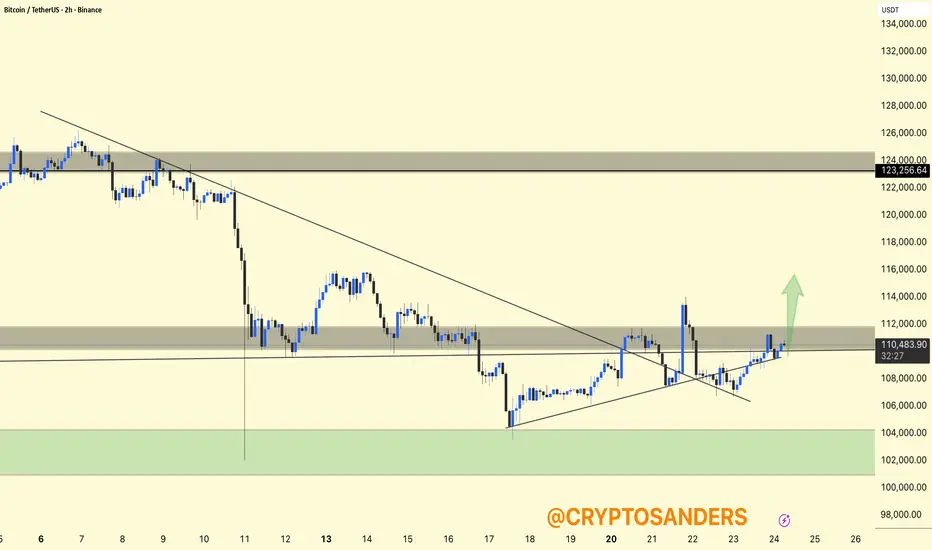
BTCUSDT Chart Analysis (2H).
Breakout: BTC has broken its descending trendline and reclaimed the $110,000 resistance area. Bulls are pushing the price towards the upper side of the supply zone marked around $112,000.
Setup: If BTC maintains a price above $110,000, the chart forecasts further upside, with the next resistance level at $115,000-$117,000.
Caution: Support is at $108,000-$110,000; losing this level could risk a retracement to $106,000-$104,000.
DYOR | NFA
Breakout: BTC has broken its descending trendline and reclaimed the $110,000 resistance area. Bulls are pushing the price towards the upper side of the supply zone marked around $112,000.
Setup: If BTC maintains a price above $110,000, the chart forecasts further upside, with the next resistance level at $115,000-$117,000.
Caution: Support is at $108,000-$110,000; losing this level could risk a retracement to $106,000-$104,000.
DYOR | NFA

منشورات ذات صلة
إخلاء المسؤولية
لا يُقصد بالمعلومات والمنشورات أن تكون، أو تشكل، أي نصيحة مالية أو استثمارية أو تجارية أو أنواع أخرى من النصائح أو التوصيات المقدمة أو المعتمدة من TradingView. اقرأ المزيد في شروط الاستخدام.
منشورات ذات صلة
إخلاء المسؤولية
لا يُقصد بالمعلومات والمنشورات أن تكون، أو تشكل، أي نصيحة مالية أو استثمارية أو تجارية أو أنواع أخرى من النصائح أو التوصيات المقدمة أو المعتمدة من TradingView. اقرأ المزيد في شروط الاستخدام.