
Bitcoin (BTC/USDT) Analysis:
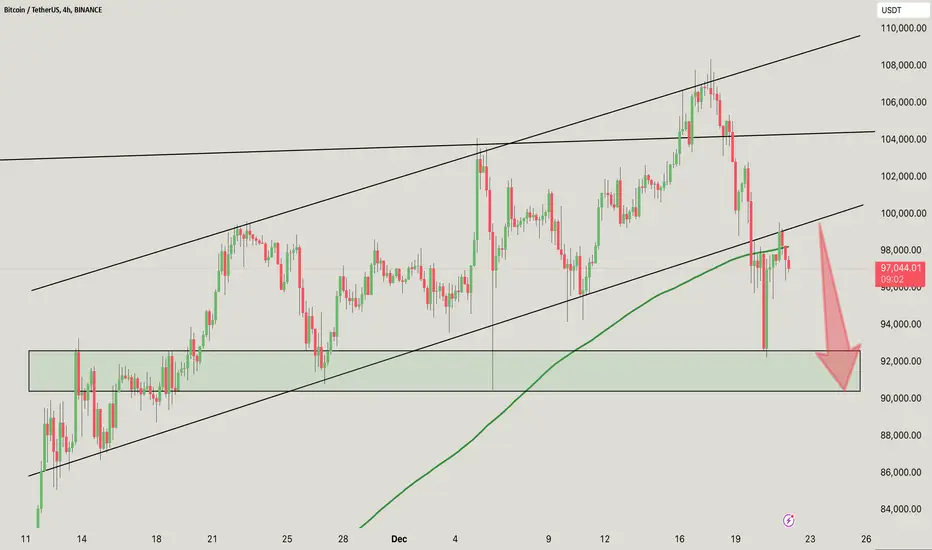
The green box marks a crucial support level between $90,000 and $92,500.
Historically, this area has acted as a strong demand zone where buyers have stepped in to increase prices.
The price has broken below the mid-boundary of the ascending channel and is currently trading near the lower boundary.
A retest of the green box is possible if the bearish momentum persists.
The green moving average (possibly 200 EMA or similar) is slightly above the current price. This suggests that the price is losing upward momentum and the moving average could act as resistance on any bounce.
The red arrow on the chart indicates a possible move downwards towards the green support zone.
DYOR, NFA
@Peter_CSAdmin
The green box marks a crucial support level between $90,000 and $92,500.
Historically, this area has acted as a strong demand zone where buyers have stepped in to increase prices.
The price has broken below the mid-boundary of the ascending channel and is currently trading near the lower boundary.
A retest of the green box is possible if the bearish momentum persists.
The green moving average (possibly 200 EMA or similar) is slightly above the current price. This suggests that the price is losing upward momentum and the moving average could act as resistance on any bounce.
The red arrow on the chart indicates a possible move downwards towards the green support zone.
DYOR, NFA
@Peter_CSAdmin

منشورات ذات صلة
إخلاء المسؤولية
لا يُقصد بالمعلومات والمنشورات أن تكون، أو تشكل، أي نصيحة مالية أو استثمارية أو تجارية أو أنواع أخرى من النصائح أو التوصيات المقدمة أو المعتمدة من TradingView. اقرأ المزيد في شروط الاستخدام.
منشورات ذات صلة
إخلاء المسؤولية
لا يُقصد بالمعلومات والمنشورات أن تكون، أو تشكل، أي نصيحة مالية أو استثمارية أو تجارية أو أنواع أخرى من النصائح أو التوصيات المقدمة أو المعتمدة من TradingView. اقرأ المزيد في شروط الاستخدام.