
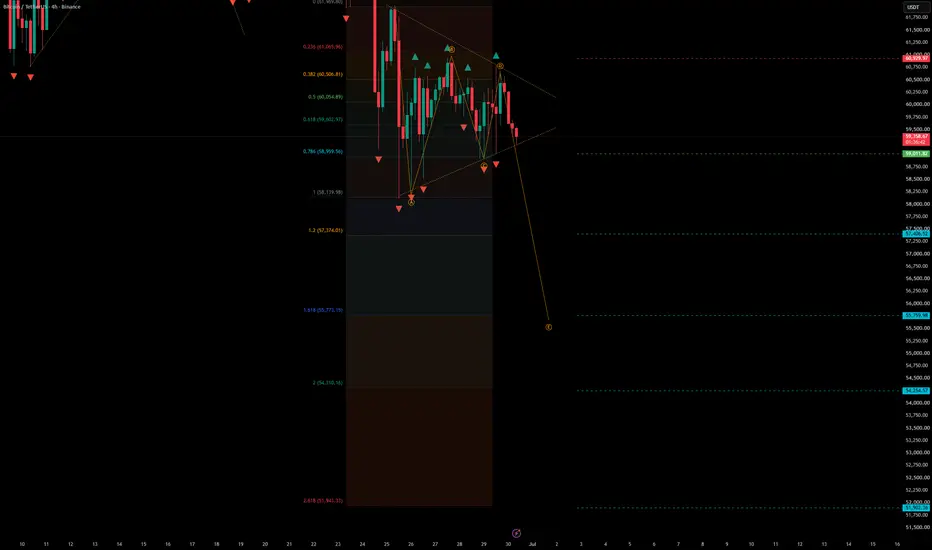
Bitcoin / TetherUS (BTCUSDT) — H4
Triangular Structure Formation + Bearish Continuation Scenario
🔎 Market Structure — H4
On the H4 timeframe, BTCUSDT is forming a triangular consolidation structure within the broader downward movement.
Price is compressing inside the local triangle, while the overall structure remains bearish. The current setup suggests that the market may be preparing for continuation to the downside after losing momentum near the upper part of the formation.
Key technical signals:
formation of a local triangular structure
continuation setup within a bearish trend
rejection from the upper boundary of the triangle
lower highs inside the consolidation
bearish pressure near the breakdown zone
downside impulse activation below the local structure
This type of structure often acts as a continuation pattern when it appears after a strong bearish move.
📐 Technical Context
The current triangle appears to be developing as a pause before potential continuation of the previous downside impulse.
The bearish scenario remains active while BTC stays below the local maximum and continues to trade under the descending resistance line.
📌 Key principle:
The setup remains valid as long as price stays below the local maximum.
A breakout above this level would weaken the bearish continuation scenario and may indicate a shift toward a deeper corrective recovery.
📍 Entry
Entry: 59,011.82
The entry is positioned:
near the lower part of the triangular structure
after rejection from local resistance
within the bearish continuation activation zone
with invalidation placed above the local maximum
🎯 Target Levels — Bearish Continuation Projections
Targets are based on the projected downside continuation structure and key support zones:
TP1: 57,406.52
TP2: 55,759.98
TP3: 54,254.57
TP4: 51,902.36
Each target represents a potential reaction zone where partial profit-taking or temporary consolidation may occur during the continuation of the bearish movement.
🛑 Invalidation / Stop Loss
Stop Loss: 60,929.97
The stop is placed behind the local maximum, which:
protects the setup from structural invalidation
confirms that the bearish continuation scenario is no longer valid if breached
keeps risk clearly defined above the triangle resistance area
separates normal consolidation movement from a bullish breakout attempt
📊 Risk / Reward Overview
Entry: 59,011.82
Stop: 60,929.97
Risk: approximately 3.25%
Target potential:
TP1: approximately 2.72% downside / RR ≈ 0.84
TP2: approximately 5.51% downside / RR ≈ 1.70
TP3: approximately 8.06% downside / RR ≈ 2.48
TP4: approximately 12.05% downside / RR ≈ 3.71
🧠 Risk & Trade Management
This is a bearish continuation setup based on the triangular structure forming after a previous downward impulse.
Recommended management approach:
monitor the breakdown of the triangle carefully
TP1 may act as the first reaction zone, but RR becomes stronger from TP2 onward
consider partial profit-taking at TP2 / TP3
reduce risk after confirmation of bearish continuation
move stop to breakeven only after price clearly breaks below the structure
avoid entering late after an extended breakdown candle without a pullback
📌 Summary
BTCUSDT on H4 is forming a triangular continuation structure within the broader bearish movement.
The bearish scenario remains active below 60,929.97, with downside targets at 57,406.52, 55,759.98, 54,254.57, and 51,902.36.
The setup is invalidated if price breaks above the local maximum.
Triangular Structure Formation + Bearish Continuation Scenario
🔎 Market Structure — H4
On the H4 timeframe, BTCUSDT is forming a triangular consolidation structure within the broader downward movement.
Price is compressing inside the local triangle, while the overall structure remains bearish. The current setup suggests that the market may be preparing for continuation to the downside after losing momentum near the upper part of the formation.
Key technical signals:
formation of a local triangular structure
continuation setup within a bearish trend
rejection from the upper boundary of the triangle
lower highs inside the consolidation
bearish pressure near the breakdown zone
downside impulse activation below the local structure
This type of structure often acts as a continuation pattern when it appears after a strong bearish move.
📐 Technical Context
The current triangle appears to be developing as a pause before potential continuation of the previous downside impulse.
The bearish scenario remains active while BTC stays below the local maximum and continues to trade under the descending resistance line.
📌 Key principle:
The setup remains valid as long as price stays below the local maximum.
A breakout above this level would weaken the bearish continuation scenario and may indicate a shift toward a deeper corrective recovery.
📍 Entry
Entry: 59,011.82
The entry is positioned:
near the lower part of the triangular structure
after rejection from local resistance
within the bearish continuation activation zone
with invalidation placed above the local maximum
🎯 Target Levels — Bearish Continuation Projections
Targets are based on the projected downside continuation structure and key support zones:
TP1: 57,406.52
TP2: 55,759.98
TP3: 54,254.57
TP4: 51,902.36
Each target represents a potential reaction zone where partial profit-taking or temporary consolidation may occur during the continuation of the bearish movement.
🛑 Invalidation / Stop Loss
Stop Loss: 60,929.97
The stop is placed behind the local maximum, which:
protects the setup from structural invalidation
confirms that the bearish continuation scenario is no longer valid if breached
keeps risk clearly defined above the triangle resistance area
separates normal consolidation movement from a bullish breakout attempt
📊 Risk / Reward Overview
Entry: 59,011.82
Stop: 60,929.97
Risk: approximately 3.25%
Target potential:
TP1: approximately 2.72% downside / RR ≈ 0.84
TP2: approximately 5.51% downside / RR ≈ 1.70
TP3: approximately 8.06% downside / RR ≈ 2.48
TP4: approximately 12.05% downside / RR ≈ 3.71
🧠 Risk & Trade Management
This is a bearish continuation setup based on the triangular structure forming after a previous downward impulse.
Recommended management approach:
monitor the breakdown of the triangle carefully
TP1 may act as the first reaction zone, but RR becomes stronger from TP2 onward
consider partial profit-taking at TP2 / TP3
reduce risk after confirmation of bearish continuation
move stop to breakeven only after price clearly breaks below the structure
avoid entering late after an extended breakdown candle without a pullback
📌 Summary
BTCUSDT on H4 is forming a triangular continuation structure within the broader bearish movement.
The bearish scenario remains active below 60,929.97, with downside targets at 57,406.52, 55,759.98, 54,254.57, and 51,902.36.
The setup is invalidated if price breaks above the local maximum.

إخلاء المسؤولية
لا يُقصد بالمعلومات والمنشورات أن تكون، أو تشكل، أي نصيحة مالية أو استثمارية أو تجارية أو أنواع أخرى من النصائح أو التوصيات المقدمة أو المعتمدة من TradingView. اقرأ المزيد في شروط الاستخدام.
إخلاء المسؤولية
لا يُقصد بالمعلومات والمنشورات أن تكون، أو تشكل، أي نصيحة مالية أو استثمارية أو تجارية أو أنواع أخرى من النصائح أو التوصيات المقدمة أو المعتمدة من TradingView. اقرأ المزيد في شروط الاستخدام.