
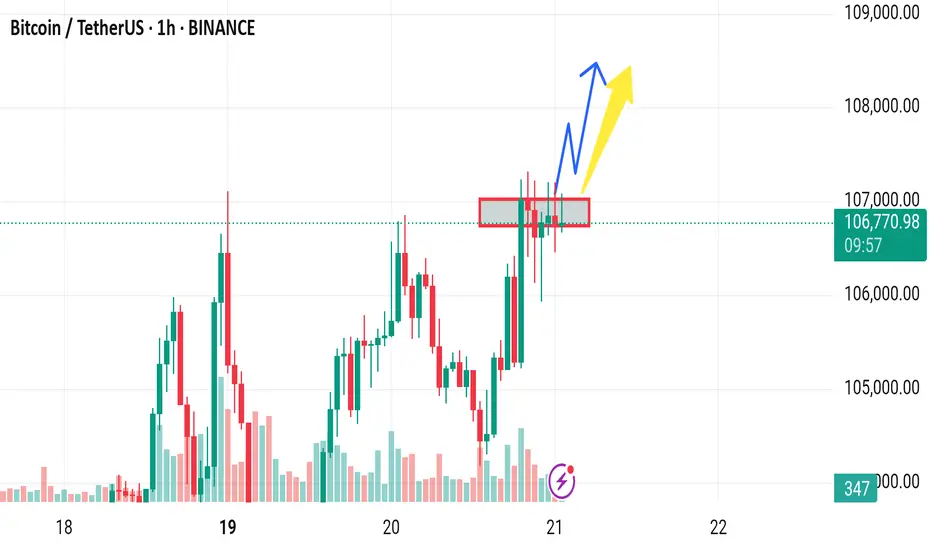
1. Weak Momentum Into Resistance
The candles near resistance are small-bodied and lack strong bullish volume.
Disruption: This signals buying exhaustion. Price could consolidate or reverse sharply, especially if buyers fail to defend this level.
---
2. Resistance Zone Saturation
The resistance zone (highlighted in red) has already been tested multiple times.
Disruption: This could either lead to a breakout or—more likely in a weak volume context—a liquidity trap and reversal, as market makers use the expectation of a breakout to trap long positions.
---
3. Potential Double Top Pattern
Look closely at the two peaks around the resistance zone. They resemble a developing double top.
Disruption: If price fails to break out convincingly and starts dropping, this double top may trigger a fall back to $105,000 or even lower.
---
4. Bearish Divergence Possibility
While not shown on this chart, in cases like this, it's common for momentum indicators (like RSI or MACD) to show bearish divergence.
Disruption: Even if price hits slightly higher highs, a divergence could signal that momentum is fading and a deeper pullback is incoming.
---
5. High Sell Volume on the Spike (May 19)
That long wick candle with high volume around May 19 suggests strong seller interest above $107K.
Disruption: Buyers could struggle again in this zone, especially if that volume spike was from whales distributing.
The candles near resistance are small-bodied and lack strong bullish volume.
Disruption: This signals buying exhaustion. Price could consolidate or reverse sharply, especially if buyers fail to defend this level.
---
2. Resistance Zone Saturation
The resistance zone (highlighted in red) has already been tested multiple times.
Disruption: This could either lead to a breakout or—more likely in a weak volume context—a liquidity trap and reversal, as market makers use the expectation of a breakout to trap long positions.
---
3. Potential Double Top Pattern
Look closely at the two peaks around the resistance zone. They resemble a developing double top.
Disruption: If price fails to break out convincingly and starts dropping, this double top may trigger a fall back to $105,000 or even lower.
---
4. Bearish Divergence Possibility
While not shown on this chart, in cases like this, it's common for momentum indicators (like RSI or MACD) to show bearish divergence.
Disruption: Even if price hits slightly higher highs, a divergence could signal that momentum is fading and a deeper pullback is incoming.
---
5. High Sell Volume on the Spike (May 19)
That long wick candle with high volume around May 19 suggests strong seller interest above $107K.
Disruption: Buyers could struggle again in this zone, especially if that volume spike was from whales distributing.

إخلاء المسؤولية
لا يُقصد بالمعلومات والمنشورات أن تكون، أو تشكل، أي نصيحة مالية أو استثمارية أو تجارية أو أنواع أخرى من النصائح أو التوصيات المقدمة أو المعتمدة من TradingView. اقرأ المزيد في شروط الاستخدام.
إخلاء المسؤولية
لا يُقصد بالمعلومات والمنشورات أن تكون، أو تشكل، أي نصيحة مالية أو استثمارية أو تجارية أو أنواع أخرى من النصائح أو التوصيات المقدمة أو المعتمدة من TradingView. اقرأ المزيد في شروط الاستخدام.