
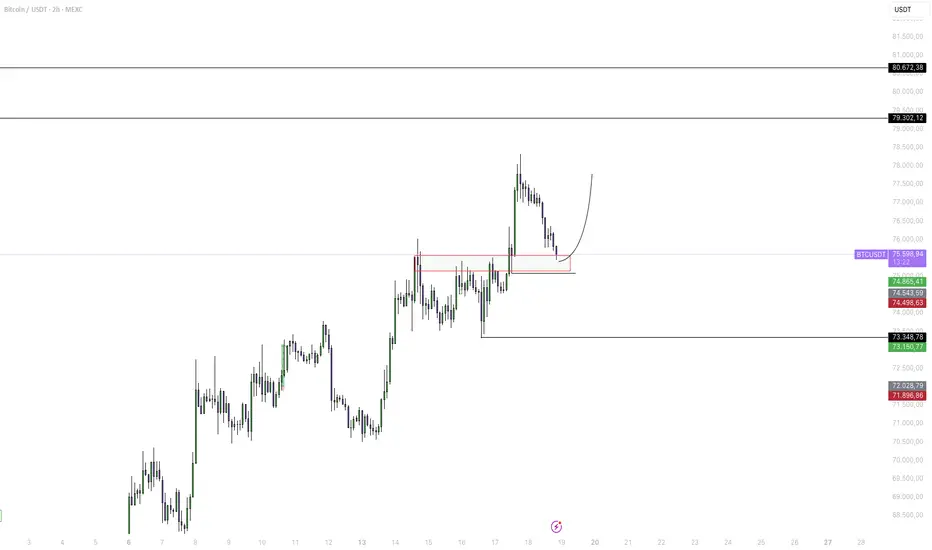
📊 BTC/USDT Analysis - 2H Timeframe
The Bitcoin chart shows a decidedly interesting setup after the recent bullish push. Here are the key points to monitor:
🔍 Current Situation
Price Action: After touching a local high around $78,500, the price has entered a natural correction phase.
Support Zone (Red Box): BTC is currently retesting a critical demand zone between $74,800 and $75,500. This area, previously a tough resistance, is now acting as support (S/R flip).
Structure: As long as we hold the low marked at $73,348, the 2H structural trend remains firmly bullish.
🎯 Key Levels
Immediate Support: $75,000 (Psychological Area + Red Box).
Resistance 1: $78,500 (Recent High).
Bullish Targets: If support holds, the next chart targets are $79,300 and then the $80,600 area.
💡 Trading Scenario
The chart indication (the curved arrow) suggests a possible rebound from the current area. A signal of strength (such as a hammer candlestick or volume absorption) in this red box could confirm a rebound toward new highs.
The Bitcoin chart shows a decidedly interesting setup after the recent bullish push. Here are the key points to monitor:
🔍 Current Situation
Price Action: After touching a local high around $78,500, the price has entered a natural correction phase.
Support Zone (Red Box): BTC is currently retesting a critical demand zone between $74,800 and $75,500. This area, previously a tough resistance, is now acting as support (S/R flip).
Structure: As long as we hold the low marked at $73,348, the 2H structural trend remains firmly bullish.
🎯 Key Levels
Immediate Support: $75,000 (Psychological Area + Red Box).
Resistance 1: $78,500 (Recent High).
Bullish Targets: If support holds, the next chart targets are $79,300 and then the $80,600 area.
💡 Trading Scenario
The chart indication (the curved arrow) suggests a possible rebound from the current area. A signal of strength (such as a hammer candlestick or volume absorption) in this red box could confirm a rebound toward new highs.

إخلاء المسؤولية
لا يُقصد بالمعلومات والمنشورات أن تكون، أو تشكل، أي نصيحة مالية أو استثمارية أو تجارية أو أنواع أخرى من النصائح أو التوصيات المقدمة أو المعتمدة من TradingView. اقرأ المزيد في شروط الاستخدام.
إخلاء المسؤولية
لا يُقصد بالمعلومات والمنشورات أن تكون، أو تشكل، أي نصيحة مالية أو استثمارية أو تجارية أو أنواع أخرى من النصائح أو التوصيات المقدمة أو المعتمدة من TradingView. اقرأ المزيد في شروط الاستخدام.