
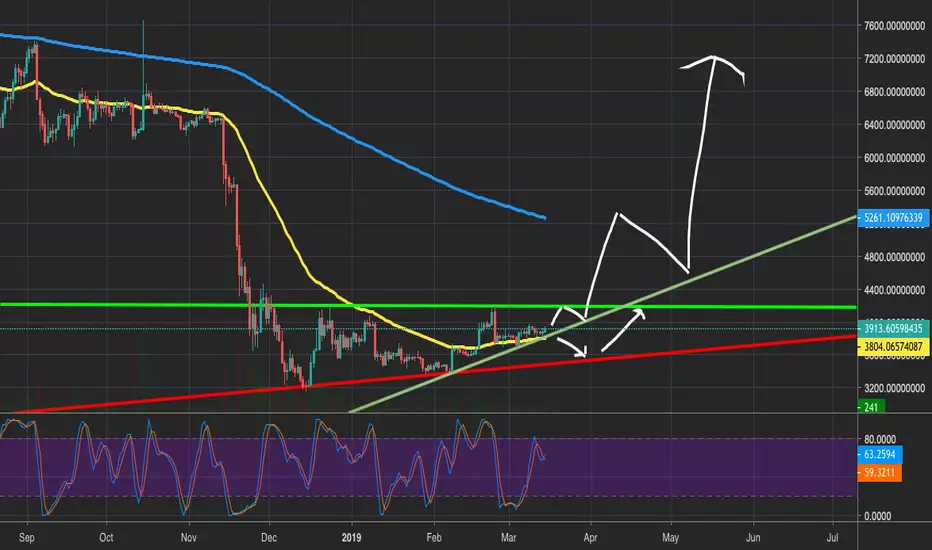
Yellow = 50 EMA
Blue = 300 EMA
After it break the vertical line at $4198. It wil most likely test the 300EMA which is the same as 50EMA on the weekly chart. On the weekly chart, the Stochastic RSI is getting to overbought levels, which is worrying, so we might see a correction soon. We have to wait and see what will happen.
Blue = 300 EMA
After it break the vertical line at $4198. It wil most likely test the 300EMA which is the same as 50EMA on the weekly chart. On the weekly chart, the Stochastic RSI is getting to overbought levels, which is worrying, so we might see a correction soon. We have to wait and see what will happen.

إخلاء المسؤولية
لا يُقصد بالمعلومات والمنشورات أن تكون، أو تشكل، أي نصيحة مالية أو استثمارية أو تجارية أو أنواع أخرى من النصائح أو التوصيات المقدمة أو المعتمدة من TradingView. اقرأ المزيد في شروط الاستخدام.
إخلاء المسؤولية
لا يُقصد بالمعلومات والمنشورات أن تكون، أو تشكل، أي نصيحة مالية أو استثمارية أو تجارية أو أنواع أخرى من النصائح أو التوصيات المقدمة أو المعتمدة من TradingView. اقرأ المزيد في شروط الاستخدام.