
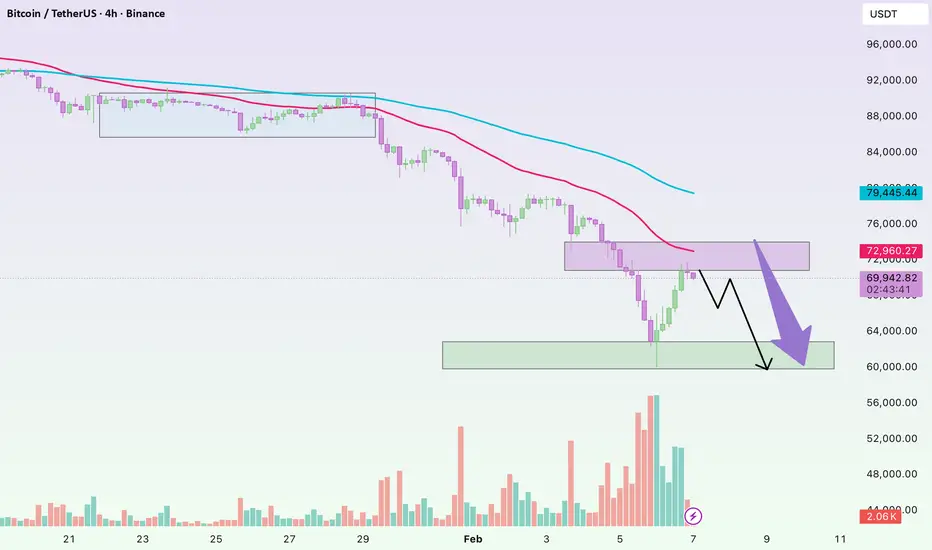
Hello everyone, looking at Bitcoin on the H4 timeframe, the overall picture hasn’t changed much. The dominant trend remains bearish, and the recent rebound is more likely a technical move rather than a genuine reversal signal.
From a structural perspective, price is still trading below the key EMA levels, and these EMAs continue to slope downward — a clear sign that selling pressure remains in control. The recent bounce came immediately after a sharp sell-off, which is a very typical characteristic of a technical rebound: price retraces to release downside pressure, but without meeting the conditions required to confirm a new uptrend. Volume supports this view as well — selling volume expanded strongly during the decline, while the rebound lacked the kind of volume that would confirm sustained buying interest.
From my experience, when price rallies but fails to reclaim the EMA zone above, it usually signals a pullback within the dominant trend rather than the start of a longer bullish phase.
So what are the key levels to watch next?
On the downside, the 63,000–65,000 USDT area is the nearest support zone I’m closely monitoring. If selling pressure continues, this is a level Bitcoin could realistically revisit to test market reaction. My base case scenario is a move down toward support, potentially followed by short-term consolidation or even a false break, before a rebound toward the resistance zone around 72,000–75,000 USDT.
Only if price can break above and hold above the medium-term EMA zone, while rebuilding a Higher High – Higher Low structure, would I begin to seriously consider a transition into a more sustainable bullish trend.
From a macro and news perspective, current pressures have not fully faded. Based on information flows from Forex Factory and other mainstream financial sources, US interest rate expectations continue to weigh on risk assets. While the market has started to talk more about potential easing in the second half of the year, the Fed has yet to deliver a sufficiently dovish signal to attract large-scale capital back into crypto. At the same time, short-term risk-off sentiment still emerges as investors react to economic data and sharp moves across global financial markets, while larger players appear more patient, waiting for deeper discounted price zones rather than chasing rebounds.
Putting everything together, I’m still leaning toward a decline–rebound–decline scenario. My personal approach is to avoid chasing buys during technical rebounds and instead focus on observing price behavior around the 63k–65k zone. If price rallies into the 72k–75k area but fails to break the broader trend structure, this region is likely to remain a notable selling zone.
What about you? Are you expecting Bitcoin to hold support and form a base, or are you still preparing for a deeper correction ahead?
From a structural perspective, price is still trading below the key EMA levels, and these EMAs continue to slope downward — a clear sign that selling pressure remains in control. The recent bounce came immediately after a sharp sell-off, which is a very typical characteristic of a technical rebound: price retraces to release downside pressure, but without meeting the conditions required to confirm a new uptrend. Volume supports this view as well — selling volume expanded strongly during the decline, while the rebound lacked the kind of volume that would confirm sustained buying interest.
From my experience, when price rallies but fails to reclaim the EMA zone above, it usually signals a pullback within the dominant trend rather than the start of a longer bullish phase.
So what are the key levels to watch next?
On the downside, the 63,000–65,000 USDT area is the nearest support zone I’m closely monitoring. If selling pressure continues, this is a level Bitcoin could realistically revisit to test market reaction. My base case scenario is a move down toward support, potentially followed by short-term consolidation or even a false break, before a rebound toward the resistance zone around 72,000–75,000 USDT.
Only if price can break above and hold above the medium-term EMA zone, while rebuilding a Higher High – Higher Low structure, would I begin to seriously consider a transition into a more sustainable bullish trend.
From a macro and news perspective, current pressures have not fully faded. Based on information flows from Forex Factory and other mainstream financial sources, US interest rate expectations continue to weigh on risk assets. While the market has started to talk more about potential easing in the second half of the year, the Fed has yet to deliver a sufficiently dovish signal to attract large-scale capital back into crypto. At the same time, short-term risk-off sentiment still emerges as investors react to economic data and sharp moves across global financial markets, while larger players appear more patient, waiting for deeper discounted price zones rather than chasing rebounds.
Putting everything together, I’m still leaning toward a decline–rebound–decline scenario. My personal approach is to avoid chasing buys during technical rebounds and instead focus on observing price behavior around the 63k–65k zone. If price rallies into the 72k–75k area but fails to break the broader trend structure, this region is likely to remain a notable selling zone.
What about you? Are you expecting Bitcoin to hold support and form a base, or are you still preparing for a deeper correction ahead?

Join our group and unlock real-time Forex, gold, and crypto signals — sharp insights, fast alerts, and opportunities you don’t want to miss.
Join now: t.me/+dfxDTk_DRtg4Mzll
Join now: t.me/+dfxDTk_DRtg4Mzll
منشورات ذات صلة
إخلاء المسؤولية
لا يُقصد بالمعلومات والمنشورات أن تكون، أو تشكل، أي نصيحة مالية أو استثمارية أو تجارية أو أنواع أخرى من النصائح أو التوصيات المقدمة أو المعتمدة من TradingView. اقرأ المزيد في شروط الاستخدام.
Join our group and unlock real-time Forex, gold, and crypto signals — sharp insights, fast alerts, and opportunities you don’t want to miss.
Join now: t.me/+dfxDTk_DRtg4Mzll
Join now: t.me/+dfxDTk_DRtg4Mzll
منشورات ذات صلة
إخلاء المسؤولية
لا يُقصد بالمعلومات والمنشورات أن تكون، أو تشكل، أي نصيحة مالية أو استثمارية أو تجارية أو أنواع أخرى من النصائح أو التوصيات المقدمة أو المعتمدة من TradingView. اقرأ المزيد في شروط الاستخدام.