
Sup Traders! 👋
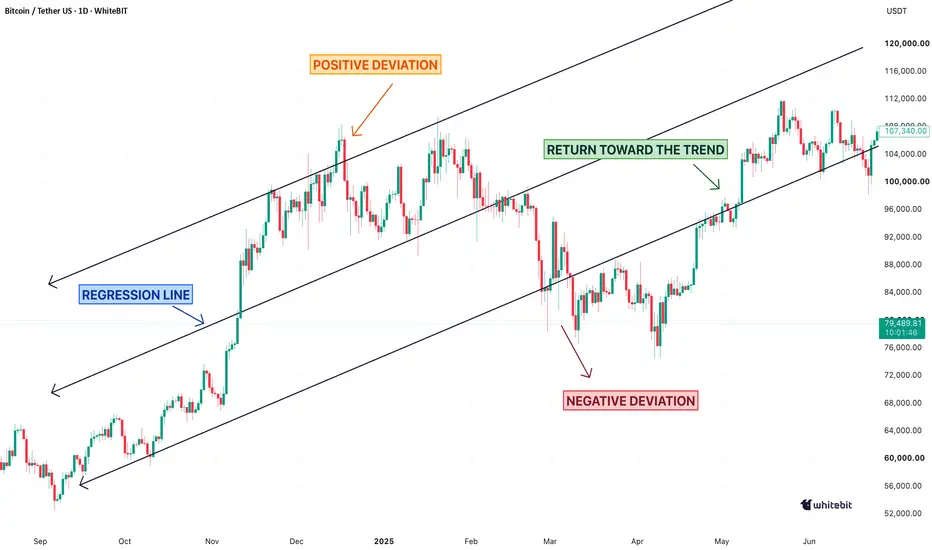
Crypto charts can be messy as hell. One minute Bitcoin is cruising, the next it’s all over the place. A linear regression channel cuts through the noise, showing where the market trend is heading and how far price movement has drifted from its normal path.
📐 What’s Under the Hood?
The linear regression indicator draws a best-fit line through price data and builds a trend channel around it. The center line reflects the general direction, while the outer bands highlight trend deviation and price deviation.
For crypto trend analysis, this beats eyeballing the chart and hoping for the best. You get cleaner trend visualization and a quick read on whether price is stretched.
🎯 How Traders Use It
In linear regression trading, start with the slope. Rising regression channel? Bulls have the wheel. Falling? Bears are calling the shots. Flat? Welcome to chop city.
Price near the upper band can signal an overheated move, while a dip toward the lower band in an uptrend may offer a cleaner entry. But don’t jump the gun — confirm the setup with volume, market structure, RSI, or support and resistance.
For bitcoin trend setups, play around with lookback periods.
🛠️ TradingView Setup
Use the tradingview regression channel across a meaningful trend, not two random points that make your setup look sexy. For better crypto chart analysis, check whether channel boundaries overlap with previous highs, lows, or breakout zones.
⚠️ Don’t Treat It Like a Crystal Ball
Linear regression crypto analysis tracks historical behavior — it doesn’t predict the future. News, liquidations, or sudden volatility can blow price straight through the channel.
Use the linear regression channel to read direction, structure, and deviation. It’s a solid map, but definitely not autopilot.
This content is for informational and educational purposes only and does not constitute financial, investment, or trading advice.
Crypto charts can be messy as hell. One minute Bitcoin is cruising, the next it’s all over the place. A linear regression channel cuts through the noise, showing where the market trend is heading and how far price movement has drifted from its normal path.
📐 What’s Under the Hood?
The linear regression indicator draws a best-fit line through price data and builds a trend channel around it. The center line reflects the general direction, while the outer bands highlight trend deviation and price deviation.
For crypto trend analysis, this beats eyeballing the chart and hoping for the best. You get cleaner trend visualization and a quick read on whether price is stretched.
🎯 How Traders Use It
In linear regression trading, start with the slope. Rising regression channel? Bulls have the wheel. Falling? Bears are calling the shots. Flat? Welcome to chop city.
Price near the upper band can signal an overheated move, while a dip toward the lower band in an uptrend may offer a cleaner entry. But don’t jump the gun — confirm the setup with volume, market structure, RSI, or support and resistance.
For bitcoin trend setups, play around with lookback periods.
- Shorter channels react faster
- Longer ones are better for historical trend analysis and filtering market noise
🛠️ TradingView Setup
Use the tradingview regression channel across a meaningful trend, not two random points that make your setup look sexy. For better crypto chart analysis, check whether channel boundaries overlap with previous highs, lows, or breakout zones.
⚠️ Don’t Treat It Like a Crystal Ball
Linear regression crypto analysis tracks historical behavior — it doesn’t predict the future. News, liquidations, or sudden volatility can blow price straight through the channel.
Use the linear regression channel to read direction, structure, and deviation. It’s a solid map, but definitely not autopilot.
This content is for informational and educational purposes only and does not constitute financial, investment, or trading advice.

Rate us & share your experience.
Thanks for being part of our community 🚀
👉 Leave your review here: tradingview.com/broker/WhiteBIT/reviews/
Thanks for being part of our community 🚀
👉 Leave your review here: tradingview.com/broker/WhiteBIT/reviews/
إخلاء المسؤولية
لا يُقصد بالمعلومات والمنشورات أن تكون، أو تشكل، أي نصيحة مالية أو استثمارية أو تجارية أو أنواع أخرى من النصائح أو التوصيات المقدمة أو المعتمدة من TradingView. اقرأ المزيد في شروط الاستخدام.
Rate us & share your experience.
Thanks for being part of our community 🚀
👉 Leave your review here: tradingview.com/broker/WhiteBIT/reviews/
Thanks for being part of our community 🚀
👉 Leave your review here: tradingview.com/broker/WhiteBIT/reviews/
إخلاء المسؤولية
لا يُقصد بالمعلومات والمنشورات أن تكون، أو تشكل، أي نصيحة مالية أو استثمارية أو تجارية أو أنواع أخرى من النصائح أو التوصيات المقدمة أو المعتمدة من TradingView. اقرأ المزيد في شروط الاستخدام.