Current Price Action of 
 BTCUSDT :
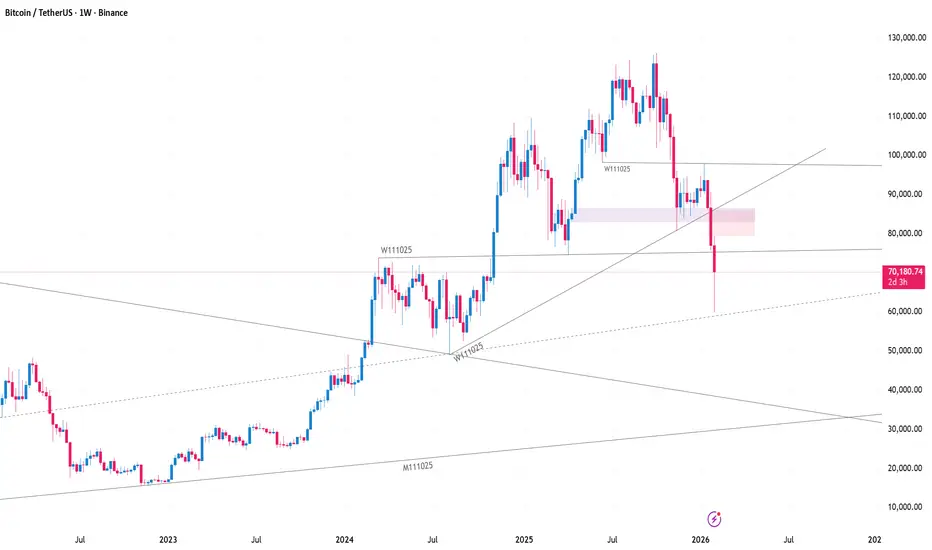
BTCUSDT is trading around $70,000, sharply down from recent highs above $120,000.
The last weekly candle shows a strong bearish momentum, with a long lower wick, indicating that buyers are trying to defend lower levels but are currently overwhelmed.
Support and Resistance:
Immediate Support: ~$60,000, which is the recent weekly low. A break here could trigger a larger correction.
Next Major Support: ~$50,000, which historically acted as a consolidation zone in 2023–2024.
Resistance: ~$80,000–$85,000, which is a previous consolidation and swing area. Any bounce may face sellers here.
Volume Analysis: Weekly volume has spiked on this drop, indicating panic selling or institutional stop-loss clearing.
High selling volume with some lower-wick recovery could suggest liquidity grab — a common setup for potential retracement.
Trend & Market Structure: Weekly trend is currently bearish: lower highs and lower lows forming after the extended uptrend.
If BTC breaks the $60,000 level decisively, it could enter a deeper accumulation phase, potentially retesting $50,000–$45,000.
If BTC holds $60,000 and shows reversal patterns (hammer, bullish engulfing), the next target could be $80,000–$85,000 for a short-term corrective bounce.
Key Observations: The market shows high volatility, meaning careful position sizing is critical.
Weekly trendline or support confirmations will dictate whether the next move is a bounce back up or continuation down.
Traders should watch for weekly candle close signals — a close below $60,000 is bearish, a close above $75,000–$80,000 may signal short-term recovery.
HAVE A NICE WEEKEND
#TRADING BITE
BTCUSDT :BTCUSDT is trading around $70,000, sharply down from recent highs above $120,000.The last weekly candle shows a strong bearish momentum, with a long lower wick, indicating that buyers are trying to defend lower levels but are currently overwhelmed.
Support and Resistance:
Immediate Support: ~$60,000, which is the recent weekly low. A break here could trigger a larger correction.
Next Major Support: ~$50,000, which historically acted as a consolidation zone in 2023–2024.
Resistance: ~$80,000–$85,000, which is a previous consolidation and swing area. Any bounce may face sellers here.
Volume Analysis: Weekly volume has spiked on this drop, indicating panic selling or institutional stop-loss clearing.
High selling volume with some lower-wick recovery could suggest liquidity grab — a common setup for potential retracement.
Trend & Market Structure: Weekly trend is currently bearish: lower highs and lower lows forming after the extended uptrend.
If BTC breaks the $60,000 level decisively, it could enter a deeper accumulation phase, potentially retesting $50,000–$45,000.
If BTC holds $60,000 and shows reversal patterns (hammer, bullish engulfing), the next target could be $80,000–$85,000 for a short-term corrective bounce.
Key Observations: The market shows high volatility, meaning careful position sizing is critical.
Weekly trendline or support confirmations will dictate whether the next move is a bounce back up or continuation down.
Traders should watch for weekly candle close signals — a close below $60,000 is bearish, a close above $75,000–$80,000 may signal short-term recovery.
HAVE A NICE WEEKEND
#TRADING BITE

إخلاء المسؤولية
لا يُقصد بالمعلومات والمنشورات أن تكون، أو تشكل، أي نصيحة مالية أو استثمارية أو تجارية أو أنواع أخرى من النصائح أو التوصيات المقدمة أو المعتمدة من TradingView. اقرأ المزيد في شروط الاستخدام.
إخلاء المسؤولية
لا يُقصد بالمعلومات والمنشورات أن تكون، أو تشكل، أي نصيحة مالية أو استثمارية أو تجارية أو أنواع أخرى من النصائح أو التوصيات المقدمة أو المعتمدة من TradingView. اقرأ المزيد في شروط الاستخدام.